Lightweight K8s Observability For Developers
Deploy a DaemonSet and get out of the box pre-configured dashboards with application and infrastructure logs, metrics, and traces in minutes. All stored securely in your cloud.
.svg)
85%
Reduction in on call time and MTTR
20X
Faster root cause investigation
70%
Reduction in observability cost and overhead
Resolve issues faster with granular and contextualized insights
Get application logs, metrics, and traces fully correlated with Kubernetes metrics, events, and deployment changes. Access full trace payloads, including request body, headers, and code-level insights to pinpoint what broke, where, why, and who can fix it, all in a single focused view.

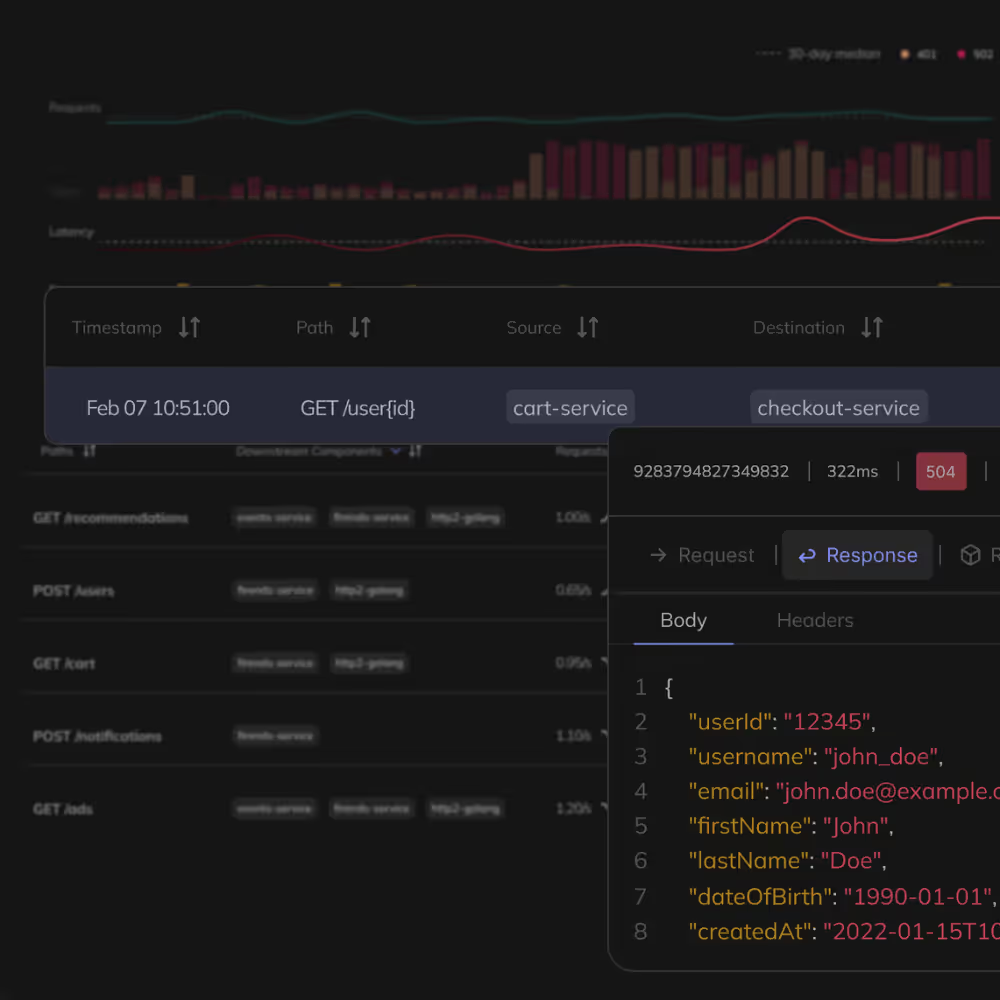
Trace every API call, DB request, message queue.
Kerno uses eBPF to automatically capture granular application data down to the payload level across any tech stack

Monitor and analyze every K8 resources to detect bottlenecks
Get full visibility into your Kubernetes nodes, pods and containers, with correlated metrics, events, and logs

Correlate deployments and config changes with issues
Get the full picture when something breaks with full visibility into new deployments and configuration changes

Reduce noise with granular context rich alerts
Use a visual interface to set service and infra alerts in minutes and route them to the right team

Explore your system visually to spot and debug bottlenecks
Get out of the box granular service maps so you can drill into individual requests and payloads to investigate problems visually

Build custom Grafana Dashboards in a few clicks
Connect Kerno Grafana in a few clicks to build custom dashboards that fit your specific needs.
Integrate with Jira or Linear
Integrate with Slack
Graph-based Runtime Context Across Prod and Pre-Prod
Unlike time series based solutions Kerno maps your runtime environments linking systems, code, and teams to understand how everything fits together and deliver context-rich insights to developers and AI agents.

Plug and play for any scale
Kerno is engineered to be lightweight, secure and cost effective to run at any scale.

Keep your sensitive data and code inside your enviorment

Keep operational footprint low at any scale
Collect and store only what matters without missing anything
Keep cost low with an object storage optimized architecture
Built on open standard to ensure interoperability
Simple, Transparent and Predicatable Pricing You Can Trust
Free Forever
$20/Per Node/Per month
Frequently Asked Questions
Got more questions? Drop us a message in our community Slack — we’re happy to help.