
The Kubernetes Dashboard is a web-based Kubernetes user interface. It has tons of features including the overview of the cluster, managing cluster resources, troubleshooting deployed applications, and health checking. Compared to operating with a command line interface, it provides a visual representation or a control panel of your cluster.
From an operational perspective, Kubernetes Dashboard removes obstacles for someone not familiar with the command line interface and allows them to participate in infrastructure support. For example, the first-tier support team can monitor the infrastructure using the dashboard to give instance responses.

In this article, I will provide some commonly used views and sub-views as examples to show you what you can get from the dashboard from a DevOps perspective. Those examples are mainly used daily in Kubernetes operations. Moreover, there will be a highlighted features section.
Installation
The Kubernetes Dashboard is not deployed by default during cluster creation. For the latest version, the official repository provides a Helm-based installation which is also the only installation method since version 7.0.0. You can still install older versions using Manifest-based installation. In this article, we will use the Helm-based installation.
To install,
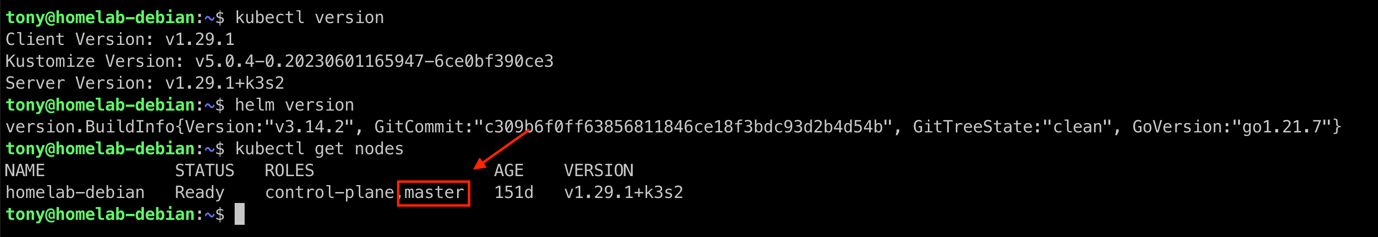
- Use any SSH client to connect to your Kubernetes master node.
- Install `kubectl` and `helm` on the master node, if they have not been installed yet.
- Add the Helm repository `kubernetes-dashboard`.
helm repo add kubernetes-dashboard https://kubernetes.github.io/dashboard/

- Deploy a Helm release named `kubernetes-dashboard` using the `kubernetes-dashboard` chart. It will create a namespace and corresponding resources on your cluster.
helm upgrade --install kubernetes-dashboard kubernetes-dashboard/kubernetes-dashboard --create-namespace --namespace kubernetes-dashboard

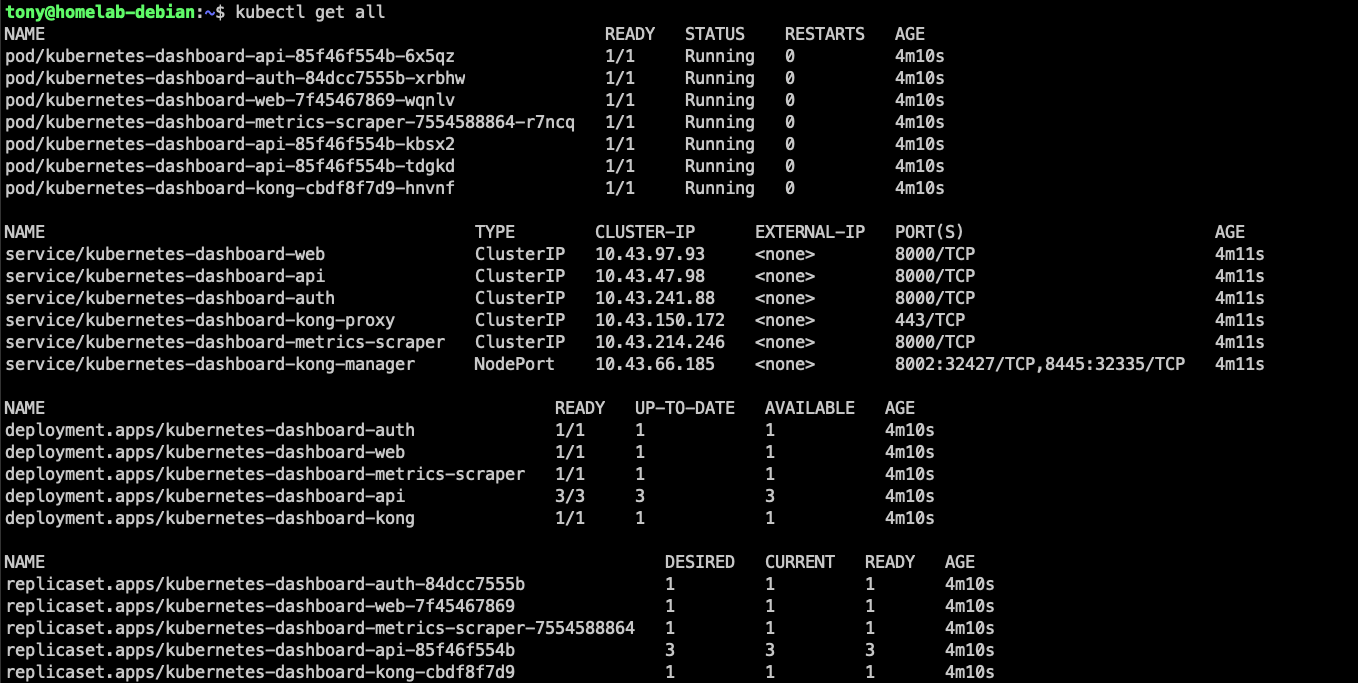
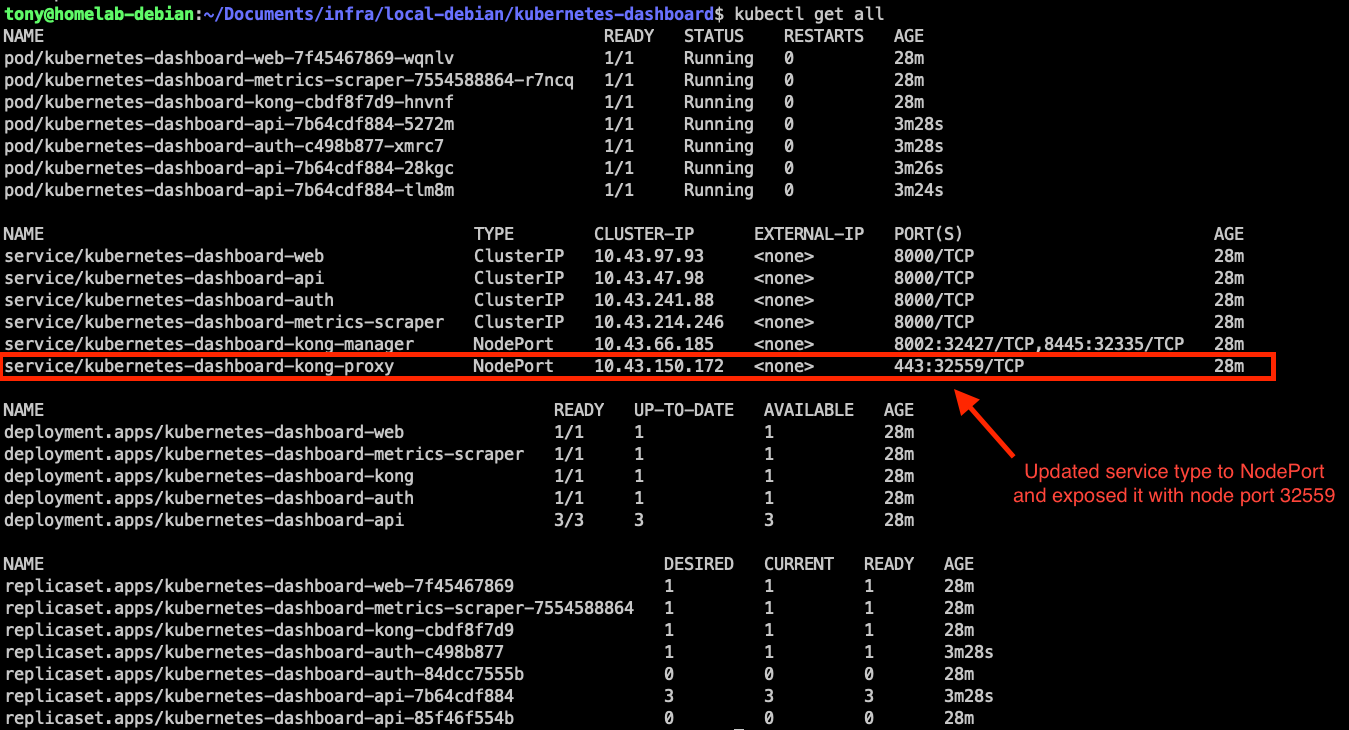
Until now, you have deployed the Kubernetes Dashboard on your cluster. However, by default, the type of the dashboard web service is `ClusterIP`, which means that it is only accessible internally within the cluster.
There are many ways to expose the dashboard services externally, such as port forwarding, using `NodePort` as the service type and access through node port, setting up `Ingress` to expose the services, etc. You should choose the way depending on your use case.
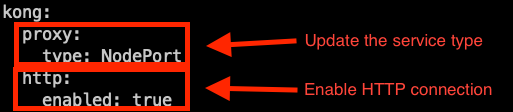
In our demo, we will update the type of service `kubernetes-dashboard-kong-proxy` to `NodePort` from `ClusterIP` and enable its HTTP connection. Then, we can access the dashboard using `<Master node IP>:<NodePort>`.
- Create a YAML file named `values.yaml` with the following content.
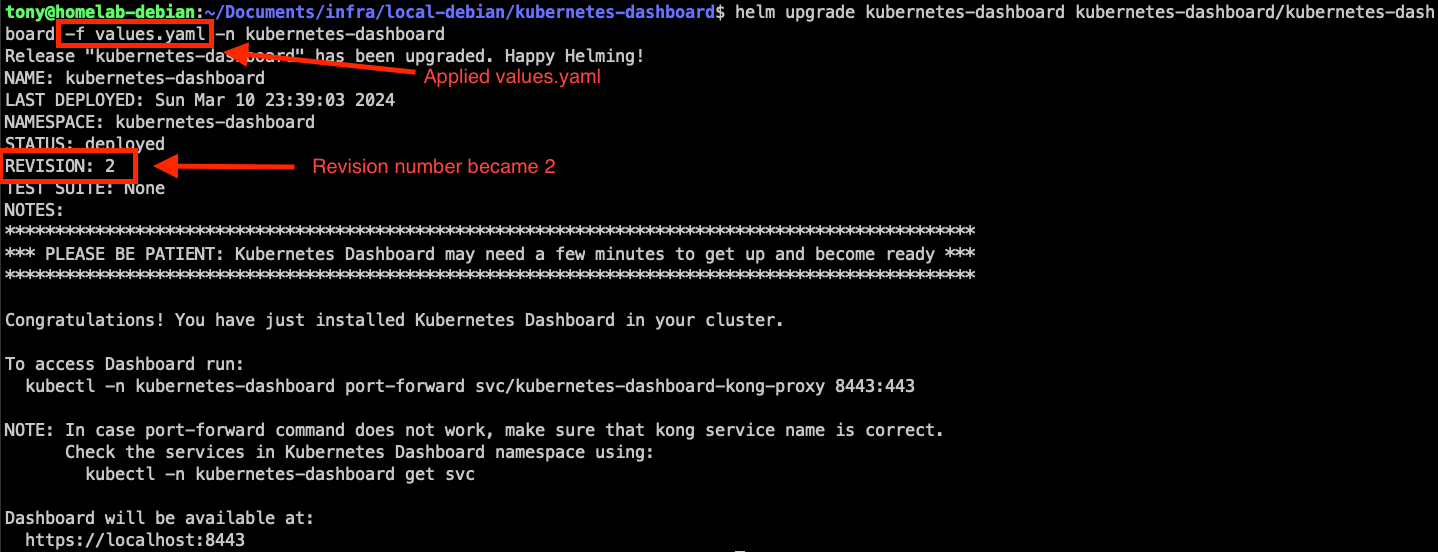
- Upgrade the Helm release with the YAML file we created in step 5. It will update the existing service.
helm upgrade kubernetes-dashboard kubernetes-dashboard/kubernetes-dashboard -f values.yaml -n kubernetes-dashboard

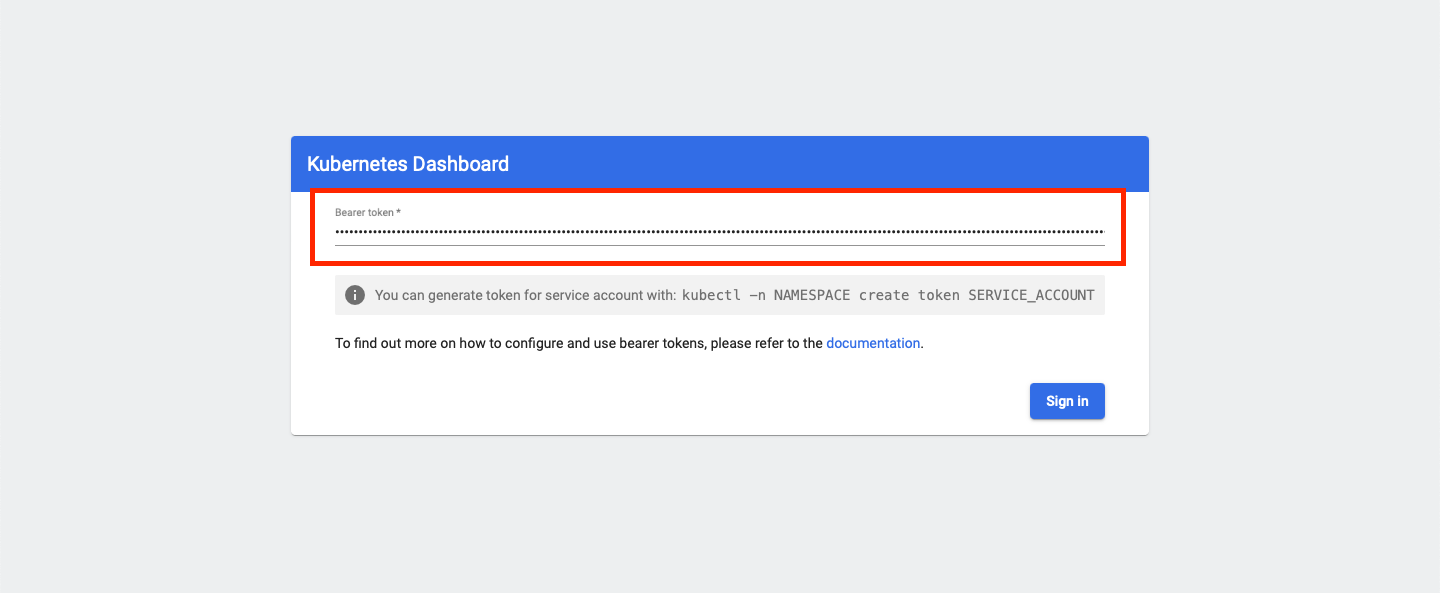
You can now see the sign-in page of Kubernetes Dashboard. It uses the Kubernetes authentication that logs in by using a bearer token generated from a service account. Therefore, we will need to create a service account, a cluster role binding, and a secret, and then get the token from the secret.
- Create a YAML file named `user.yaml` with the following content. It creates a service account with the necessary role and secret.
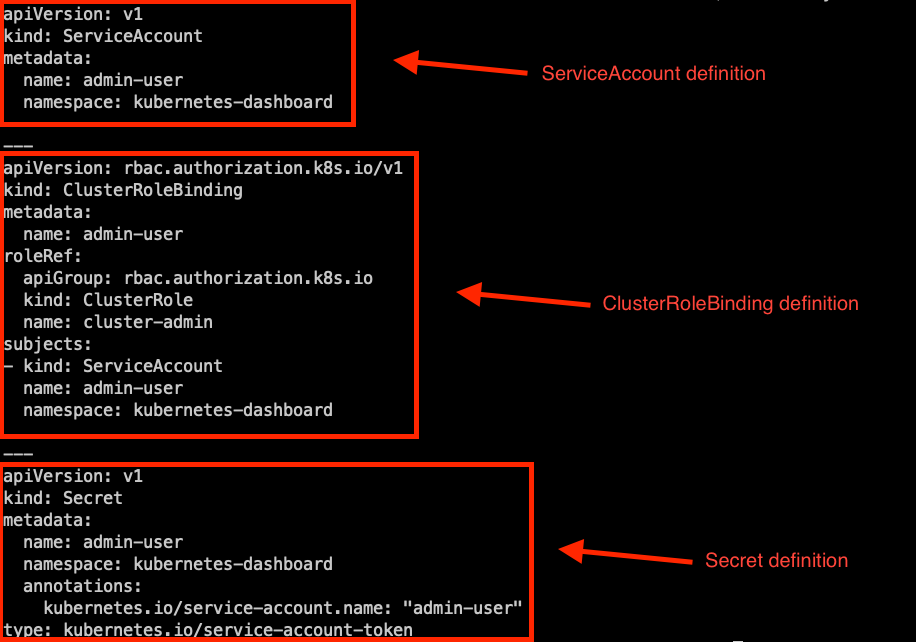
- Create the resources by applying `user.yaml`.
kubectl apply -f user.yaml

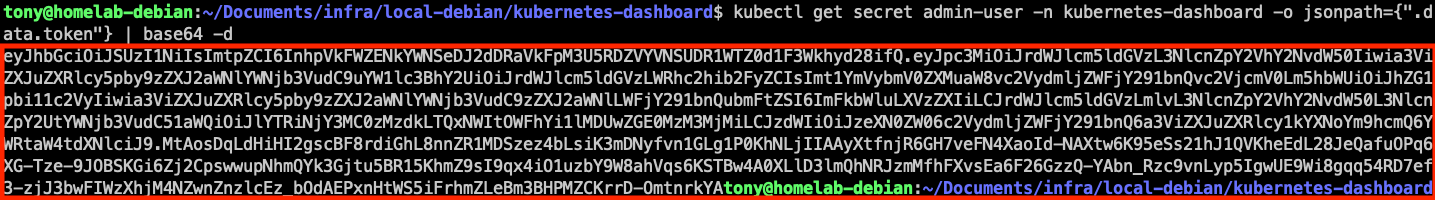
- Get the access token from the newly created secret.
kubectl get secret admin-user -n kubernetes-dashboard -o jsonpath={".data.token"} | base64 -d
- Use the token generated from Step 9 and you can now log in to the dashboard.
Overview
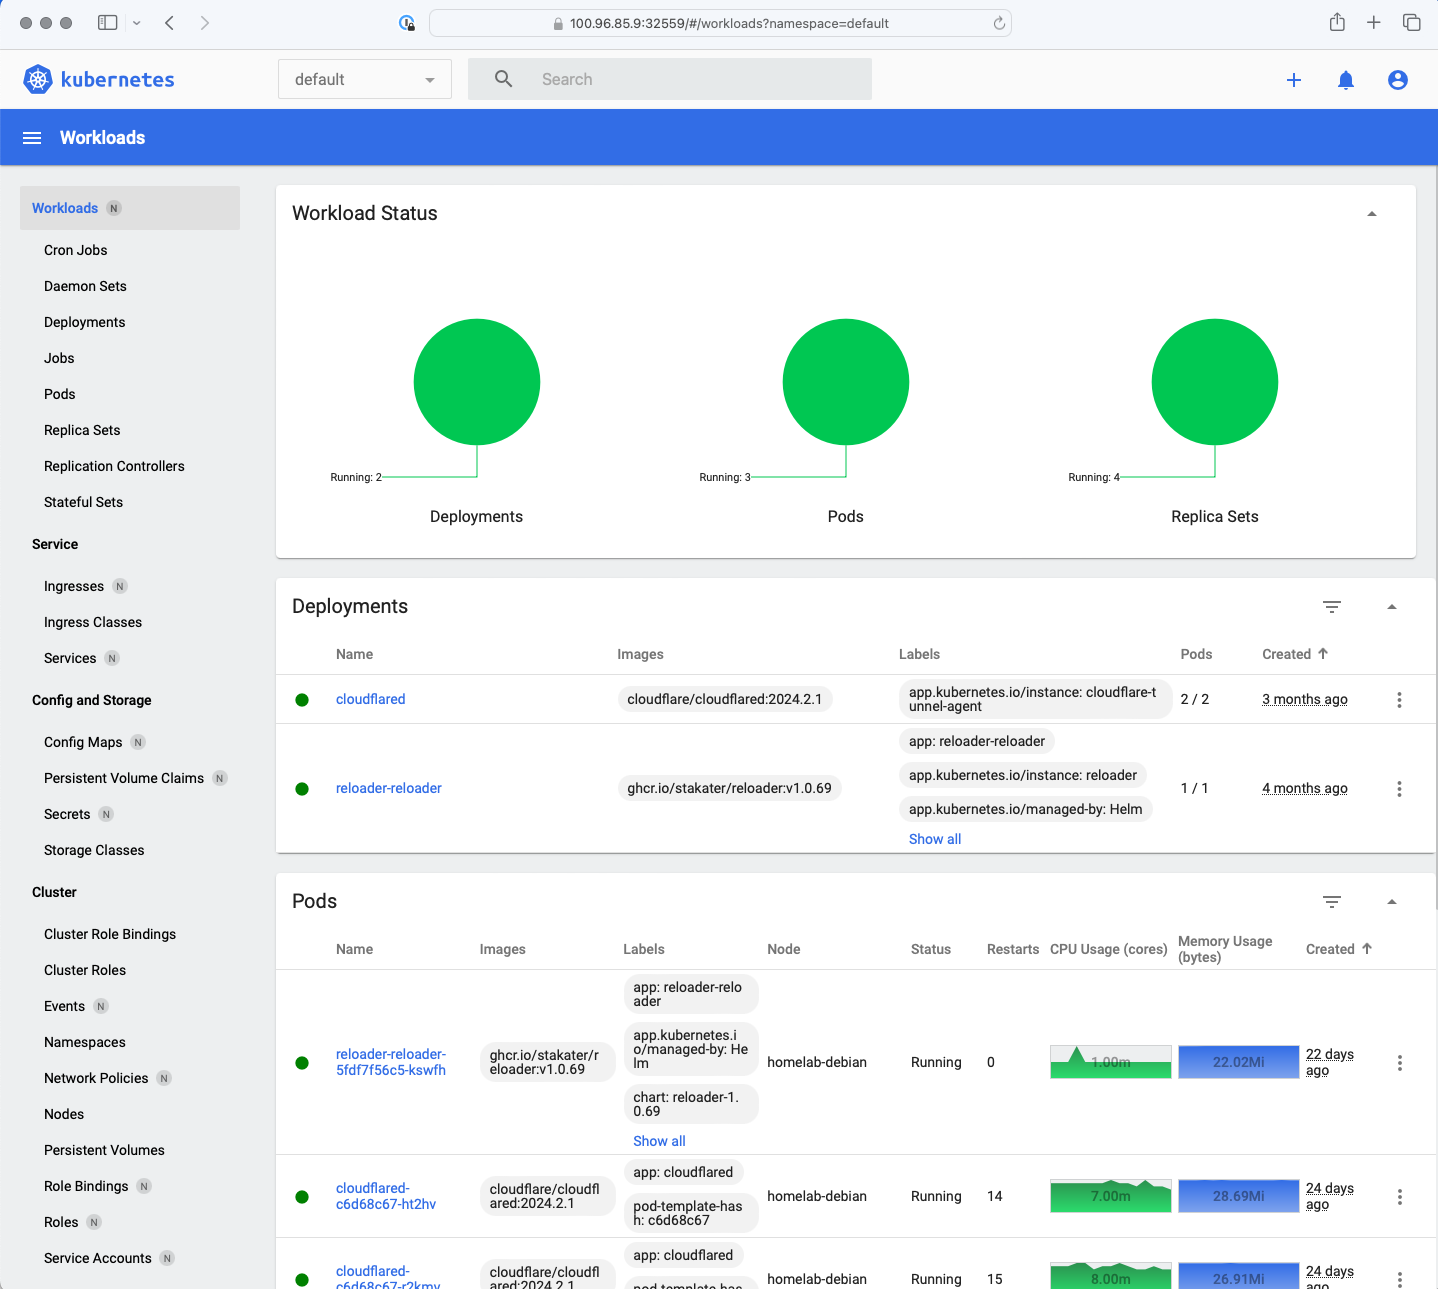
There are five components to view from the dashboard, including Workloads, Service, Config and Storage, Cluster, and Custom Resource Definitions.
Workloads
The Workloads view provides an overview of the applications in different forms deployed on the cluster. Its sub-views include Deployments, Pods, Daemon Sets, etc. Under each sub-view, you can see the metrics of the running workloads like CPU and memory usage.
Take Deployments as an example:
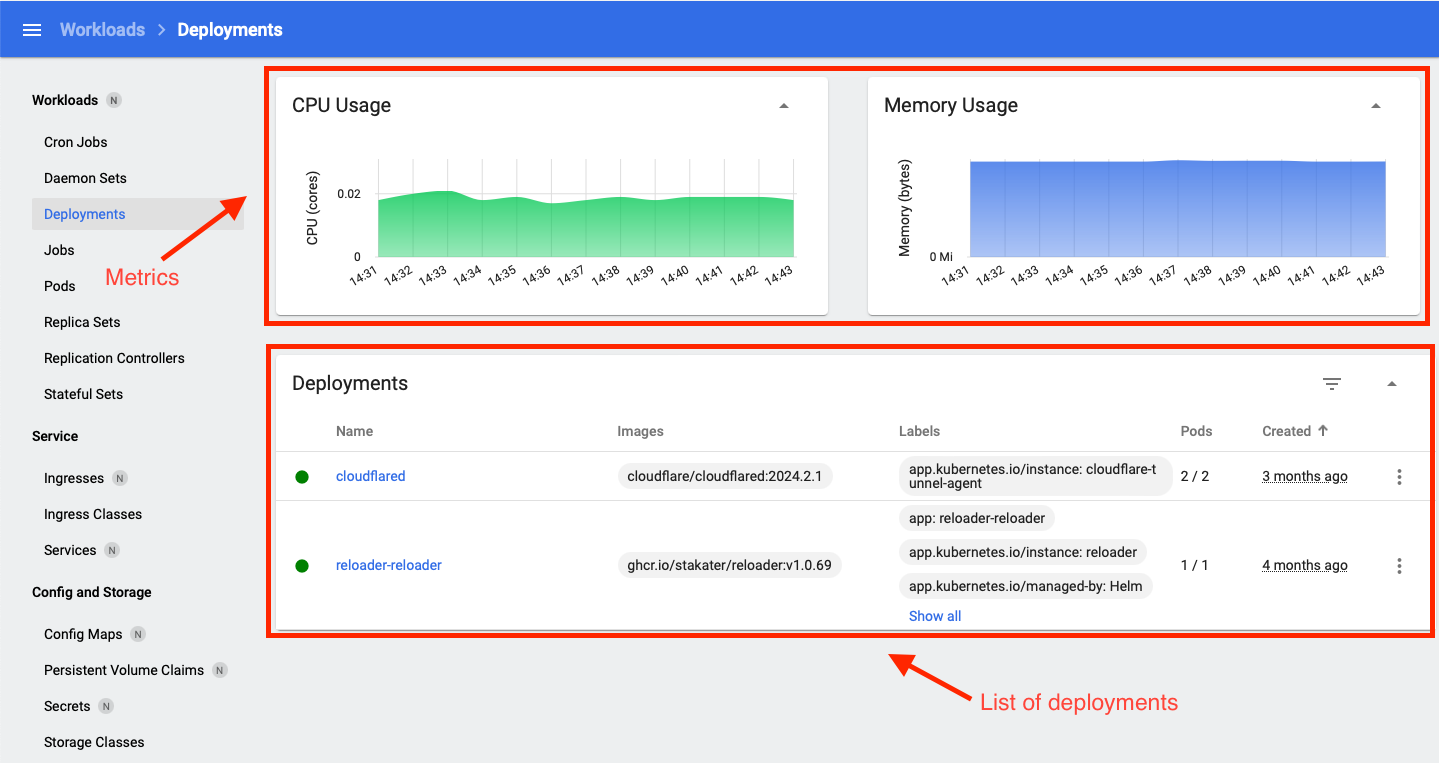
The upper part is the metrics that show the CPU and memory usage of the pods under the deployments in the current namespace selection. The metric is simply showing the recent 10 to 15 minutes of data. The lower part is the list of deployments under the current namespace selection. You can see some important information about an individual deployment like name, image, number of running pods, and labels.
You can also click on a specific deployment to see its detailed overview. It shows the metadata, deployment strategy, pod status, conditions, and attached replica sets. The information here will be updated in real time when there are some changes.

Service
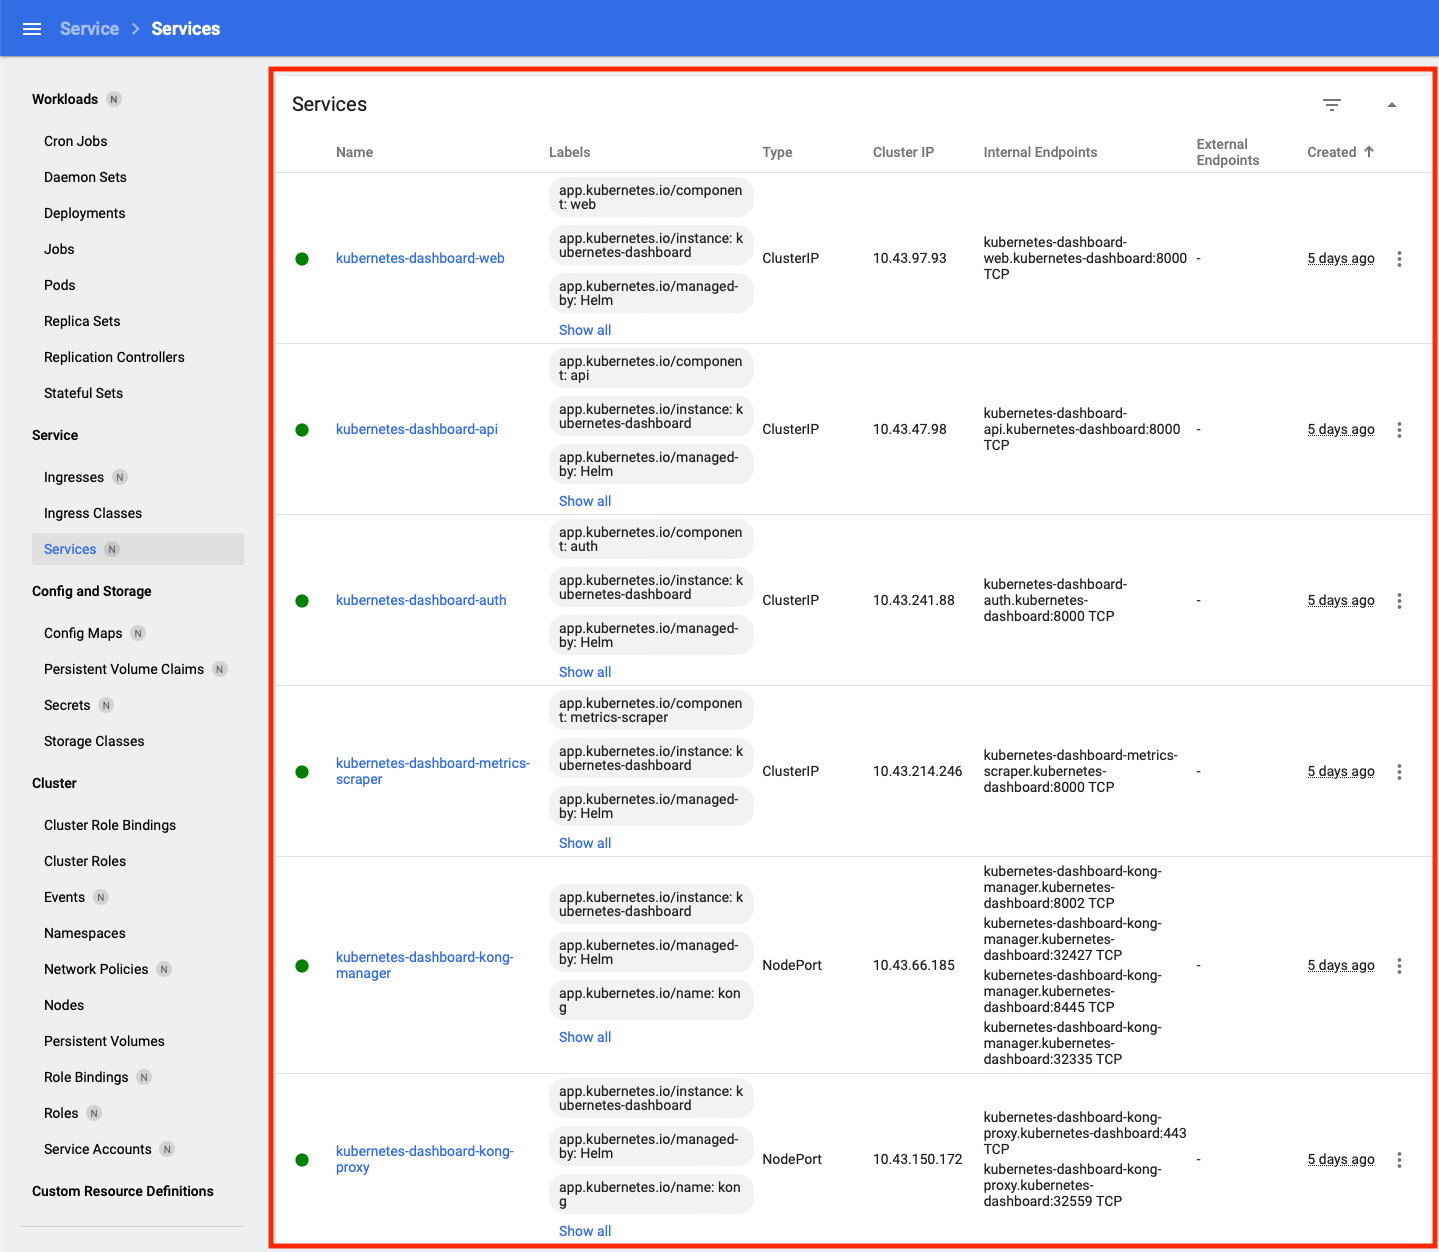
The Service view provides a comprehensive overview of the access control at the application level. The sub-views are Ingresses, Ingress Classes, and Services which show a list of the resources with their core information.
Using the Services sub-view as an example, you can get the name, labels, service type, cluster IP, and internal and external endpoints.
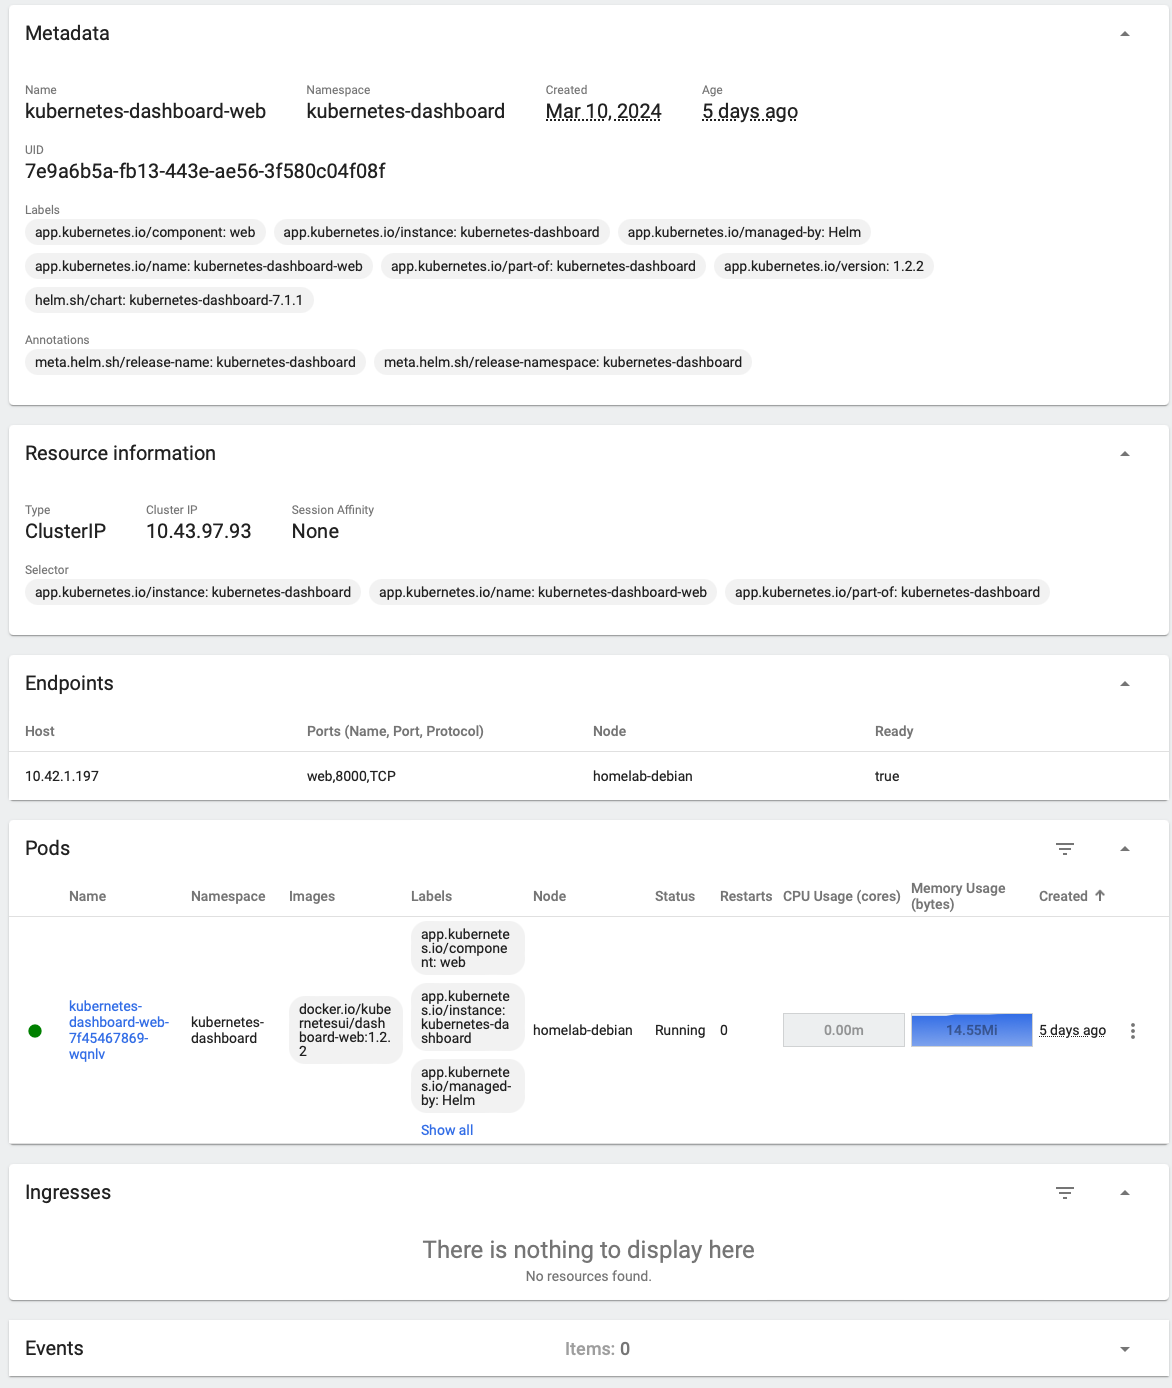
You can click any Service to see its dedicated overview, where you can see the metadata, service information, and the attached pods. It is one of the most useful views on the dashboard because it is straightforward to see the relations between services and pods, which helps to verify if the pod selector configuration works correctly.
Config and Storage
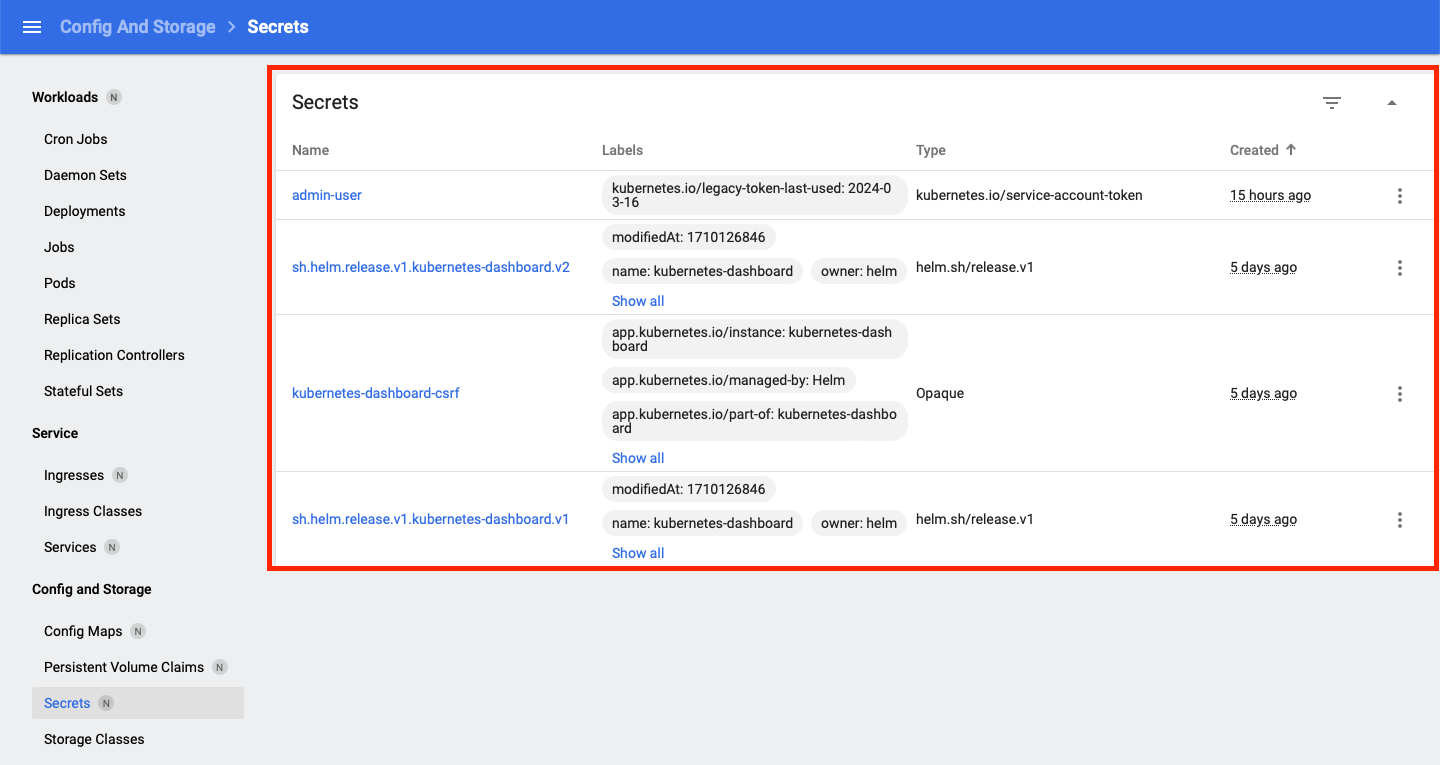
In this section, it provides an overview of Config Maps, Persistent Volume Claim, Secrets, and Storage Classes. You can find every storage and configuration item here.
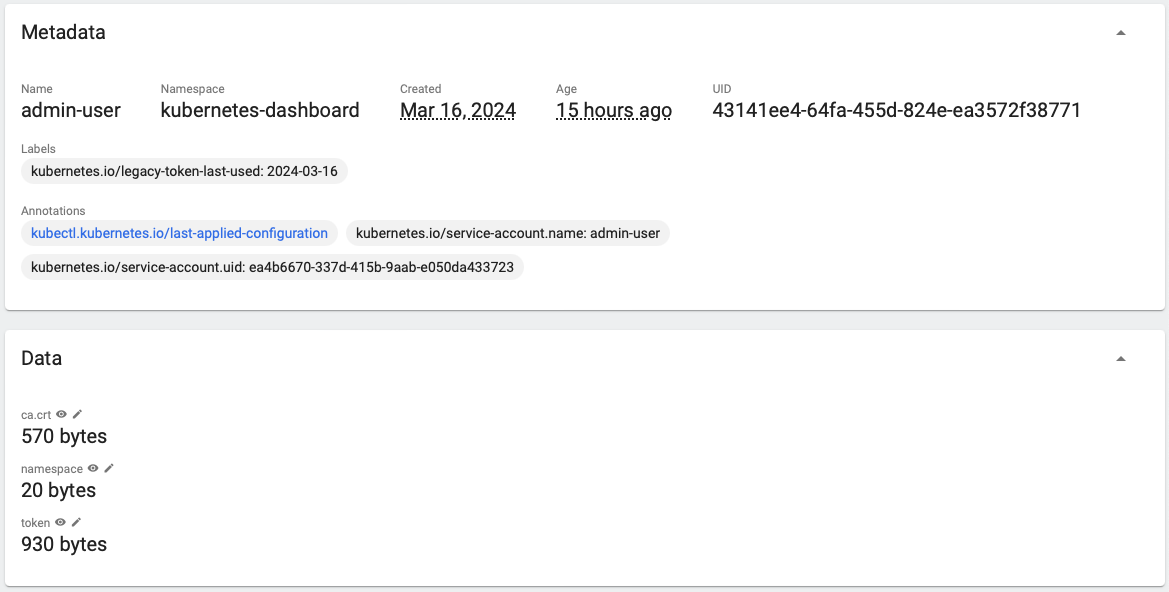
The Secrets sub-view is a list of secrets under the current namespace selection, and it simply shows the name, labels, and the secret type.
Same as other sub-views, you can click on any secret to see its detailed information. Take the secret `admin-user` we created in the Installation section as an example. You can see all the data in this secret in a hidden view. After expanding the token data, you will see the same value that we got from kubectl get secret admin-user.

Cluster
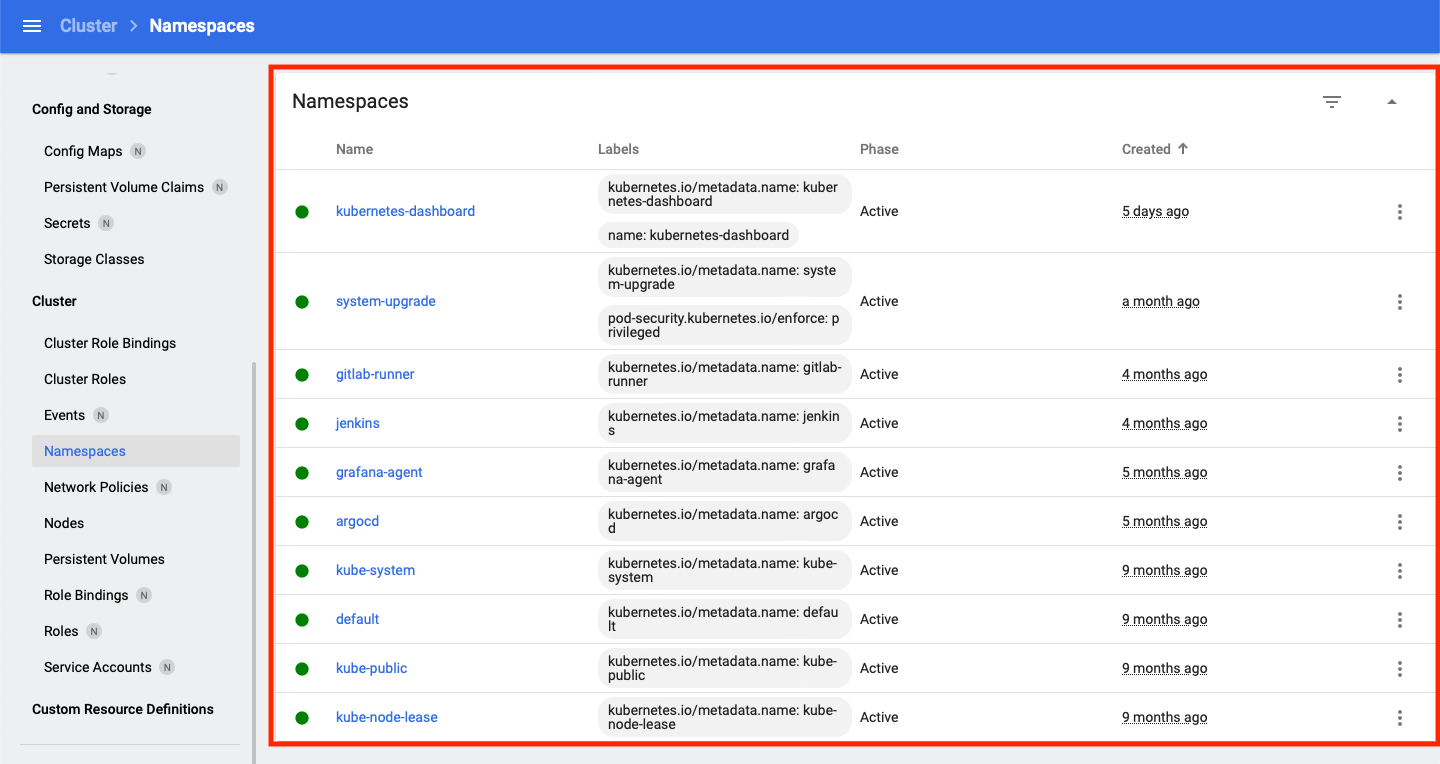
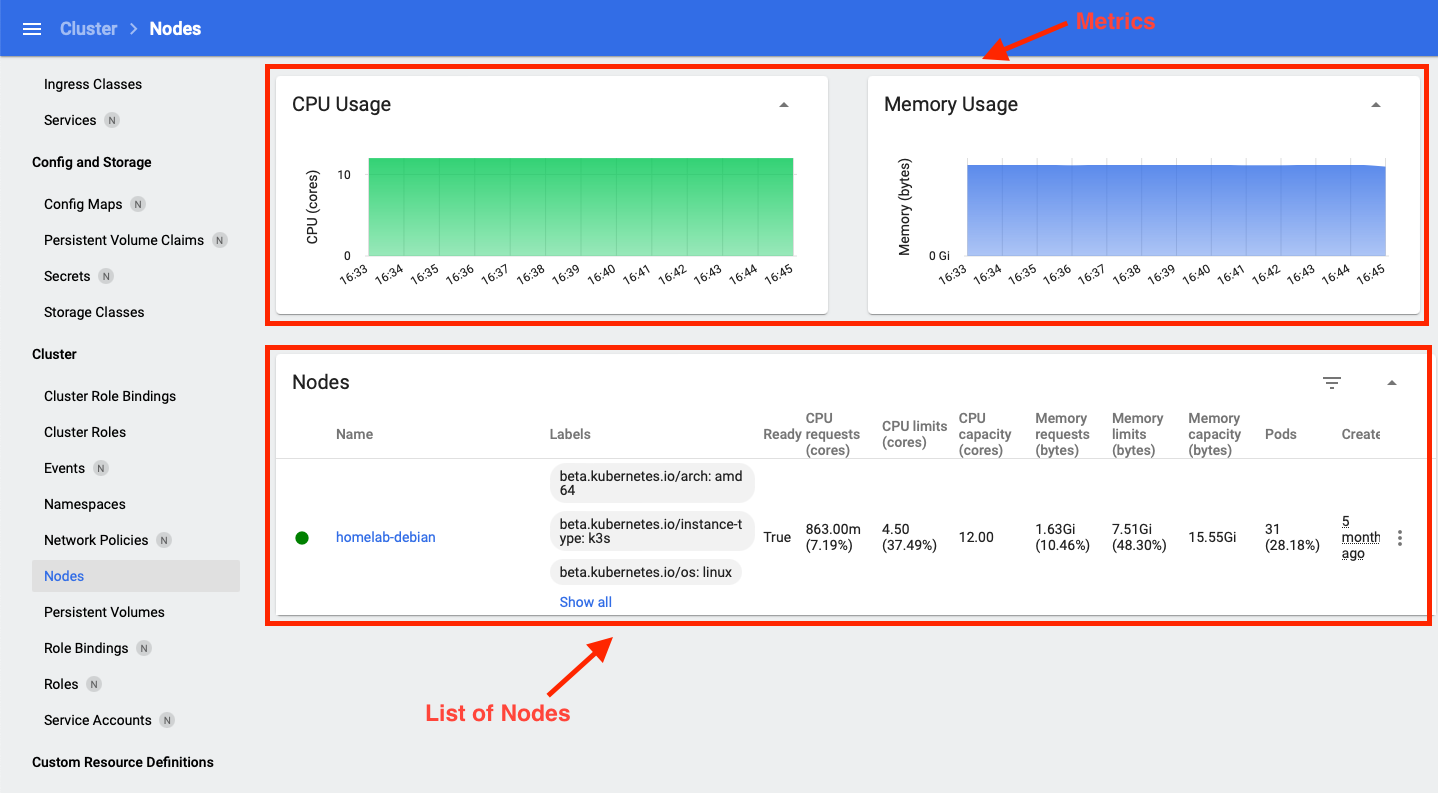
The Cluster view is the overview of ten cluster-level resources. They are Cluster Role Bindings, Cluster Roles, Events, Namespaces, Network Policies, Nodes, Persistent Volumes, Role Bindings, Roles, and Service Accounts.
We will use Nodes and Namespaces sub-views as examples.
For the namespace sub-view, it shows all the namespaces under the cluster. This page is simple but gives you a quick view of different groups of resources.
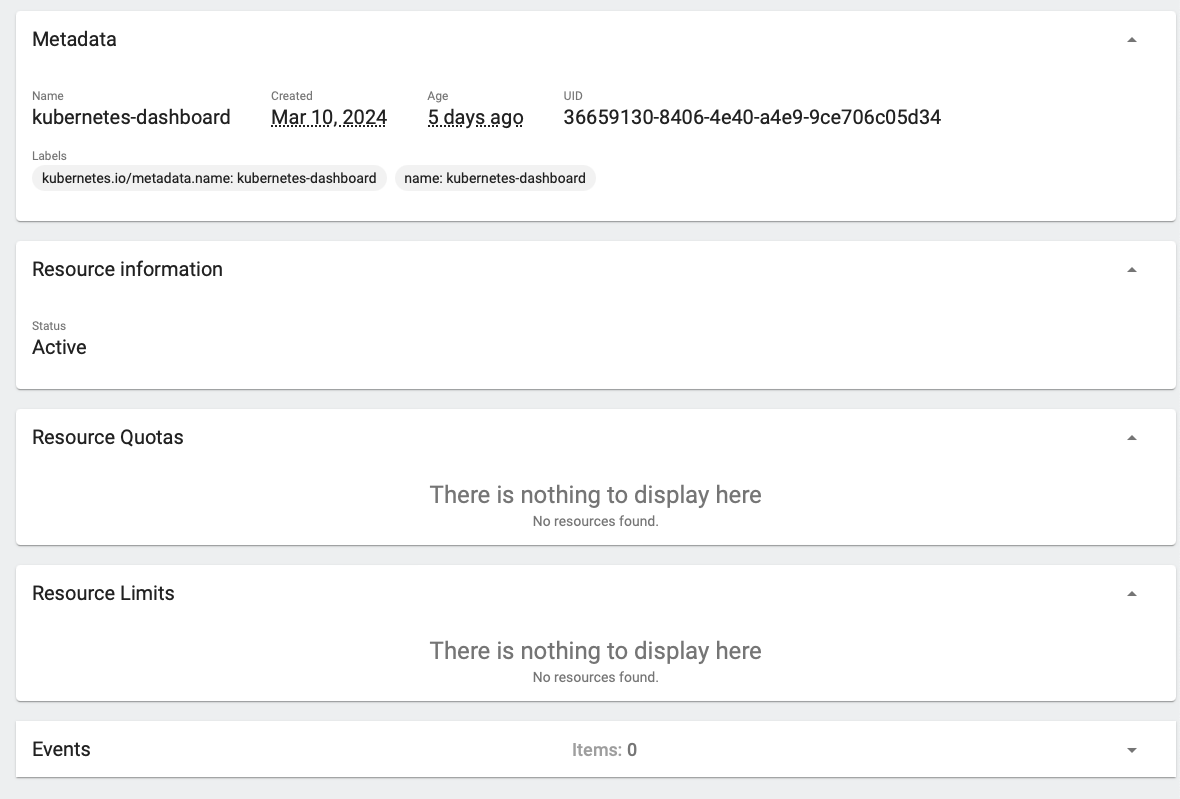
By clicking on any one of the namespaces, you will see more information here like the namespace-level resource quotas and limits.
Additionally, if you would like to get a general overview of resources at the namespace level, you can select a specific namespace on the pull-down menu at the header of the dashboard.

The Node sub-view lists all the master and worker nodes under the cluster. It gives the name, labels, CPU and memory limits, requests and capacity, and the current number of running pods. Like the Deployment sub-view under Workloads, you can see a part of the metrics and a part of the node list.
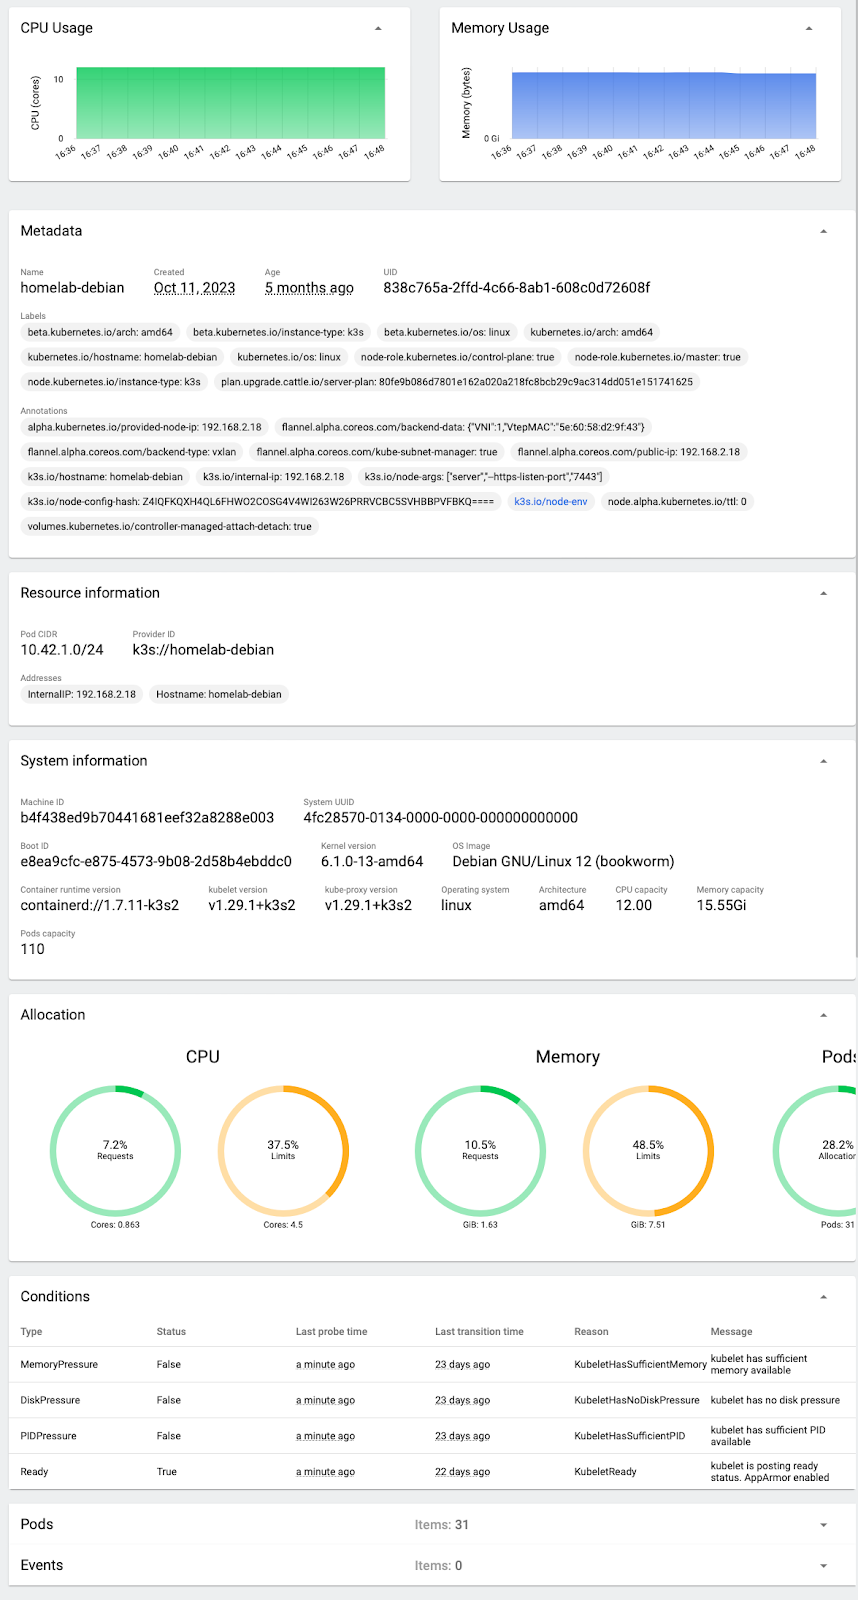
In the detailed overview of a specific node, you can see all its basic information, metrics, resource allocation, node conditions, and the list of running pods.
Key features
The Kubernetes Dashboard is not only a display dashboard but also a portal to interact with your cluster. In this section, I will show you some key features that benefit your daily Kubernetes operations as a DevOps, Site Reliability, or even a software engineer.
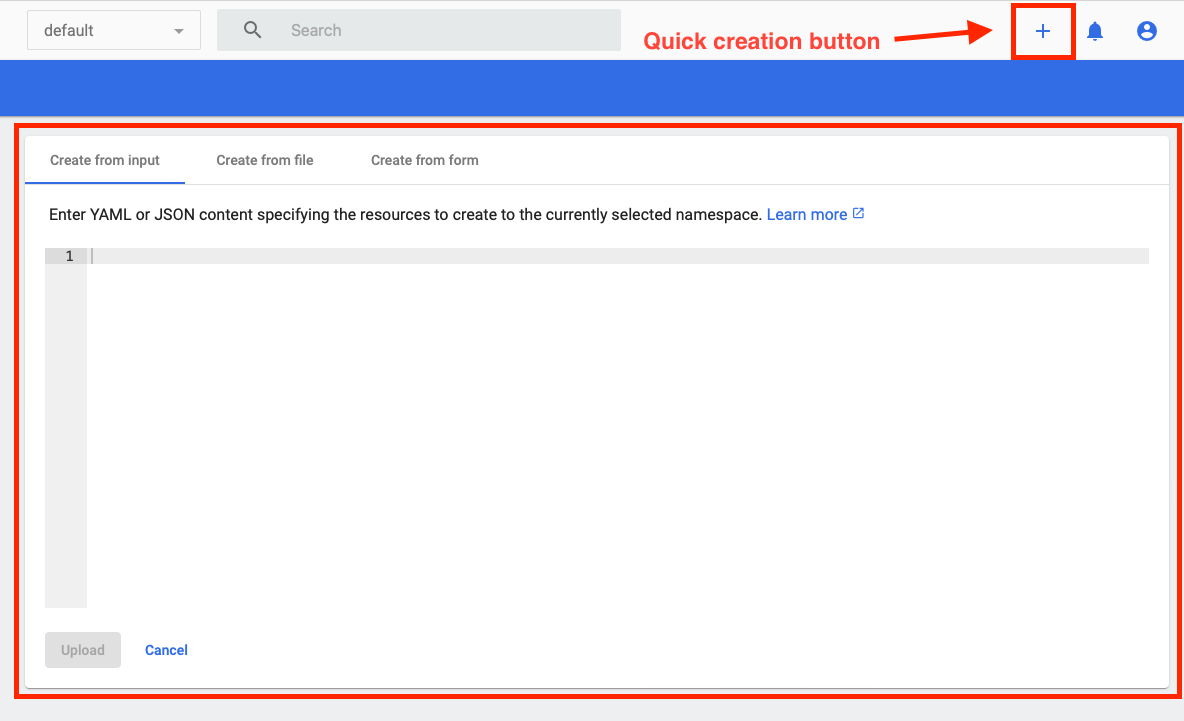
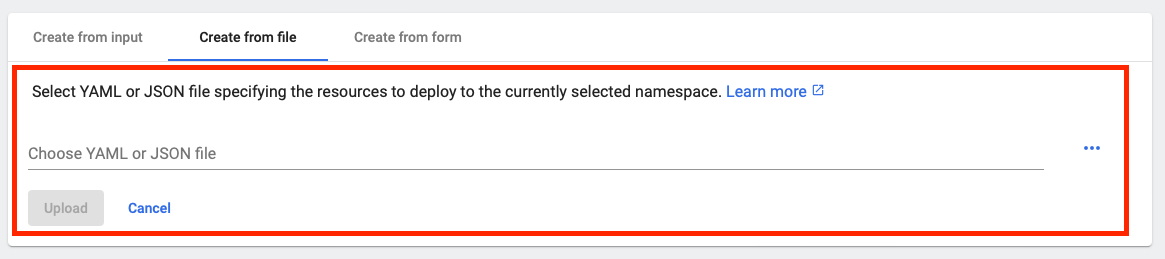
Quick creation
You can create Kubernetes resources using the portal by providing YAML or JSON content or uploading YAML or JSON files. You can also create a deployment directly by filling out the form.
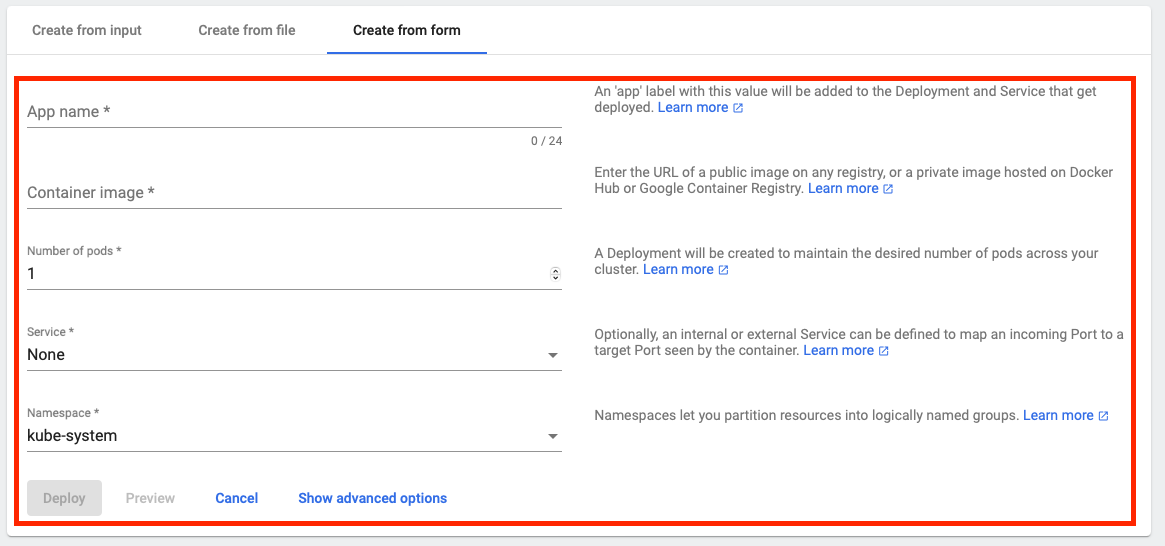
We will try to create a deployment using the form.
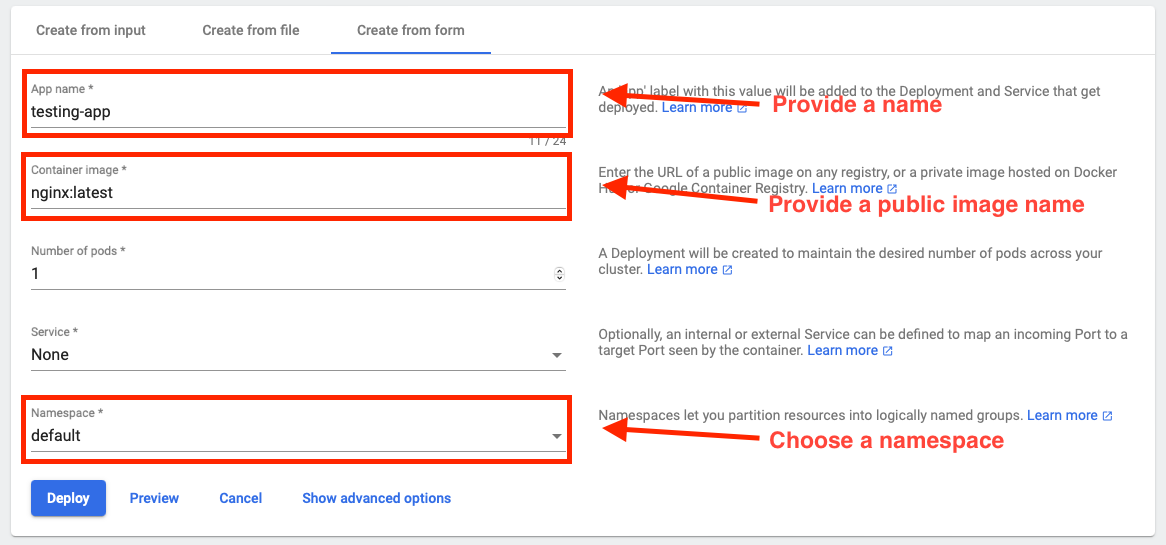
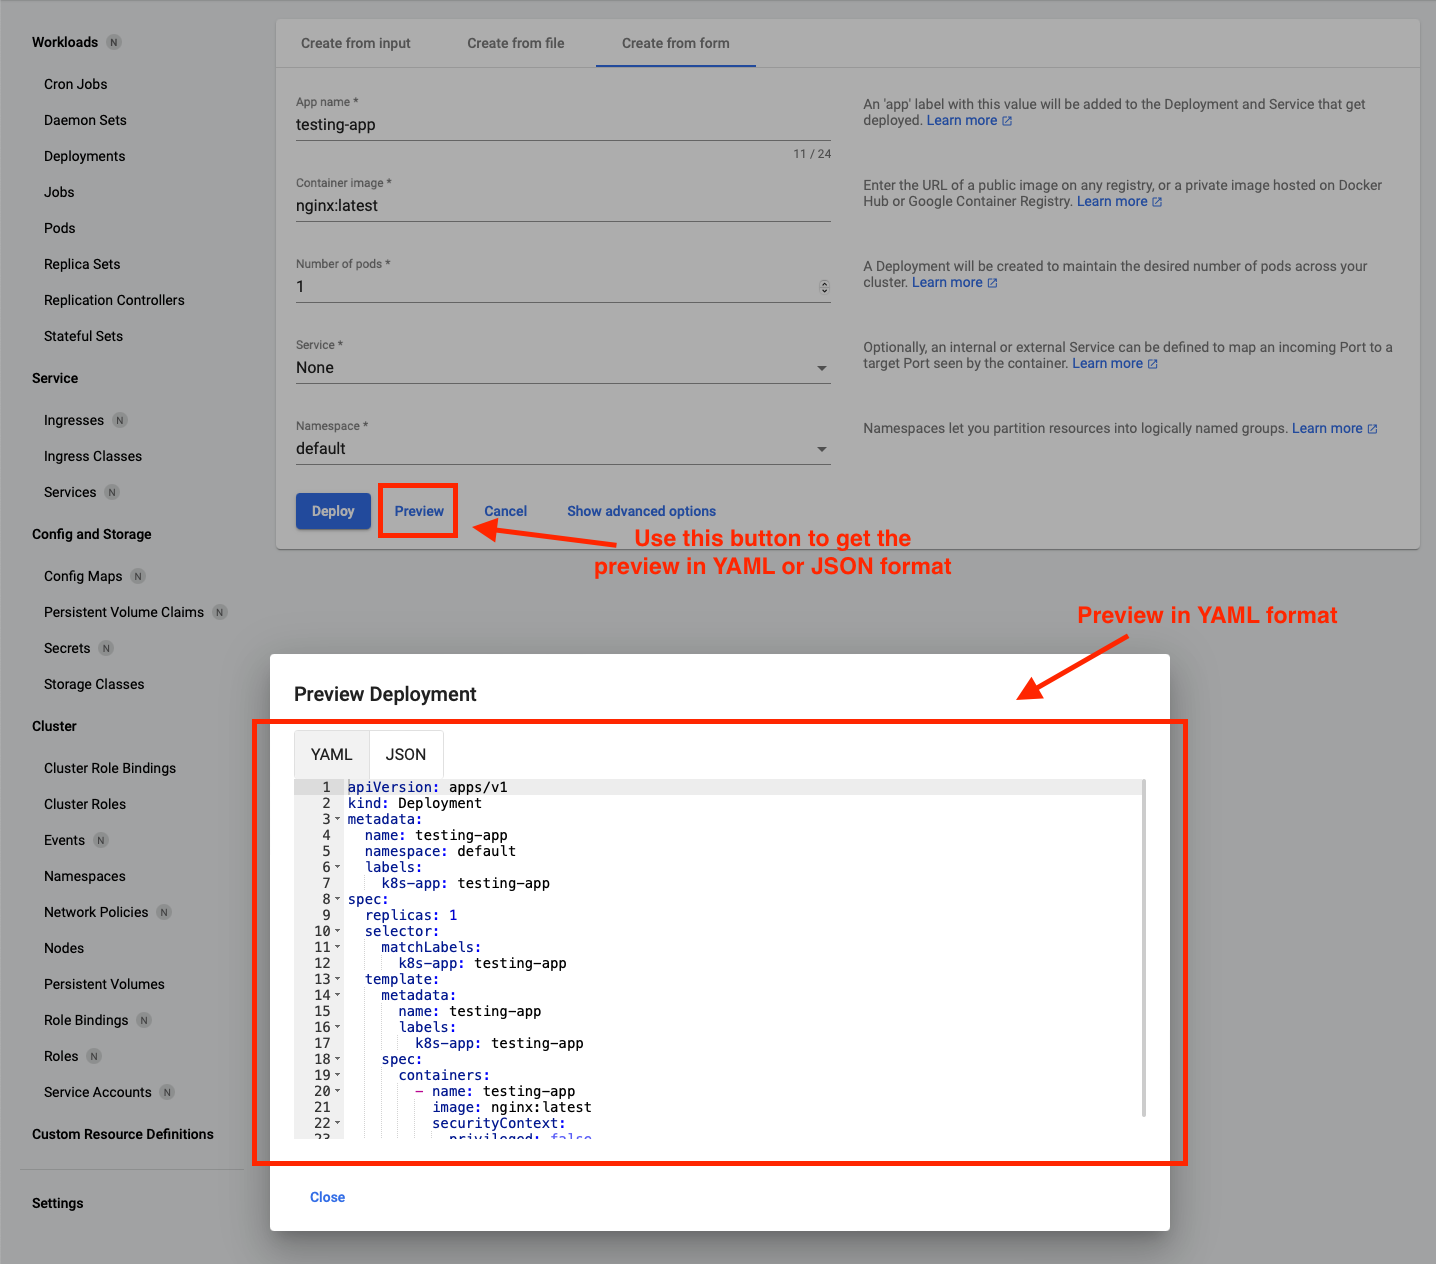
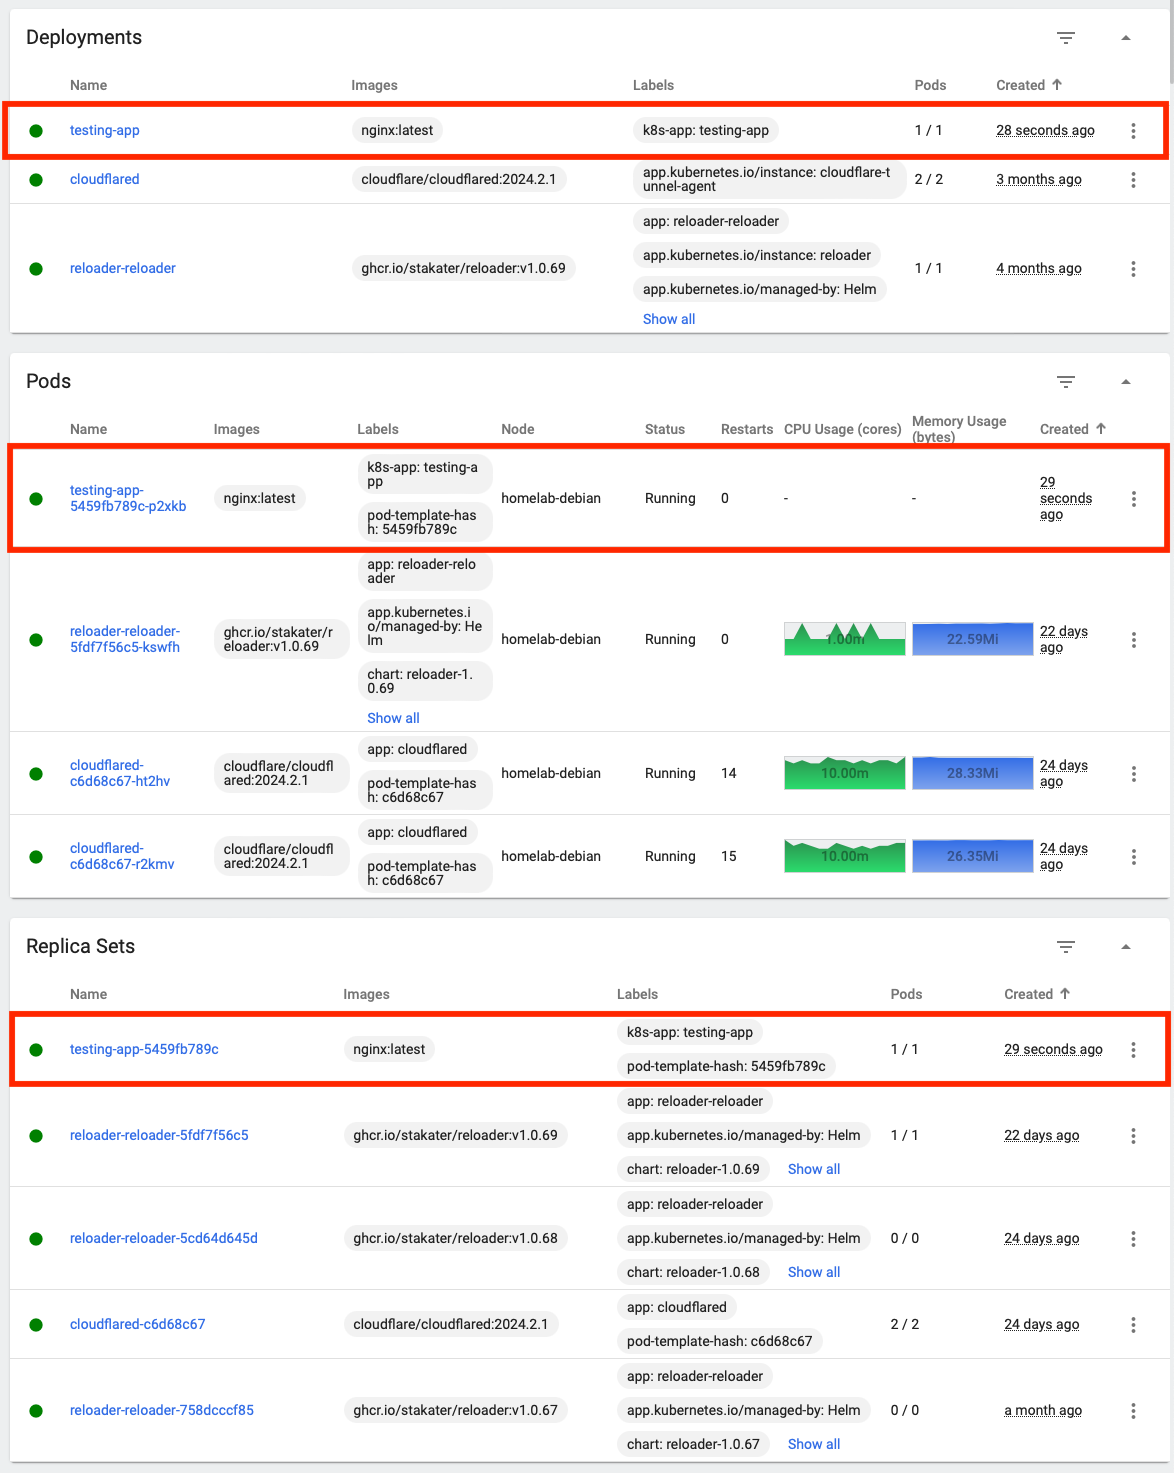
You can deploy it by clicking the Deploy button. It will redirect you to the Workloads Overview page.
Logs tailing
Logs must be one of the most important items we want from a Kubernetes cluster for bug tracking, performance checking, and many other usages. The Kubernetes Dashboard provides a feature in any Pods detailed overview page which is equivalent to the `kubectl logs` command.
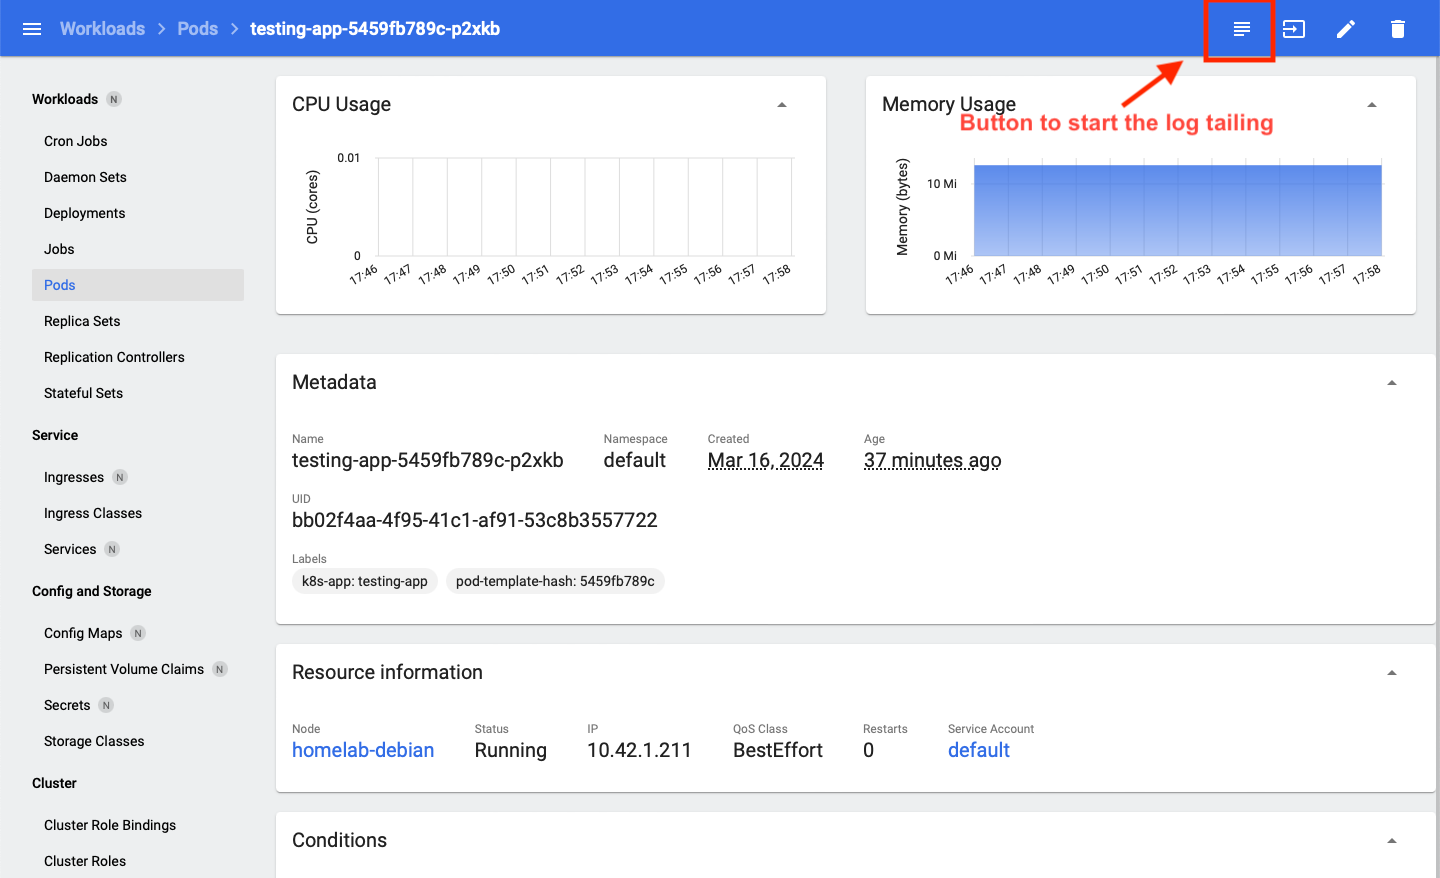
Once you click the button, you will see a black container showing the pod logs in live mode.
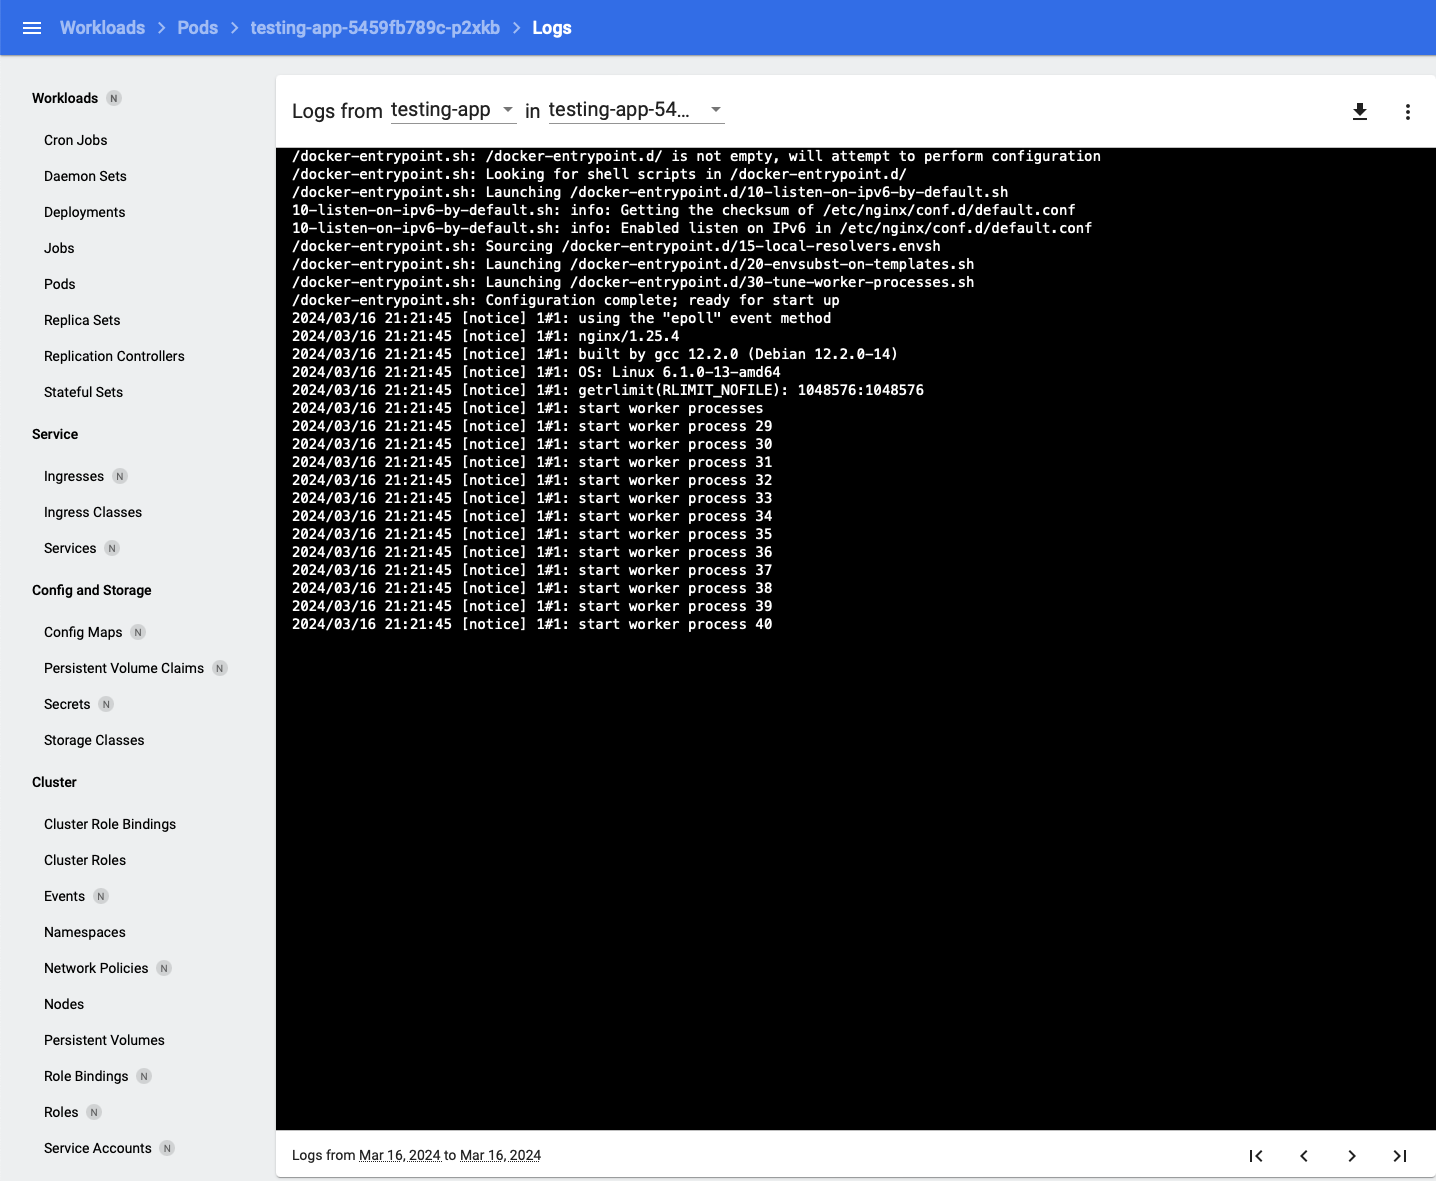
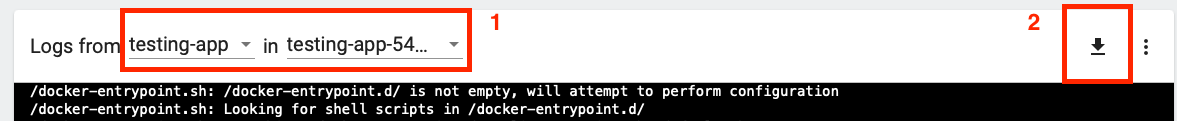
If your pod has multiple containers, you can also tail the logs by choosing the container using the pull-down list in (1) of Figure 35. Or download the logs using the button (2) of Figure 35.
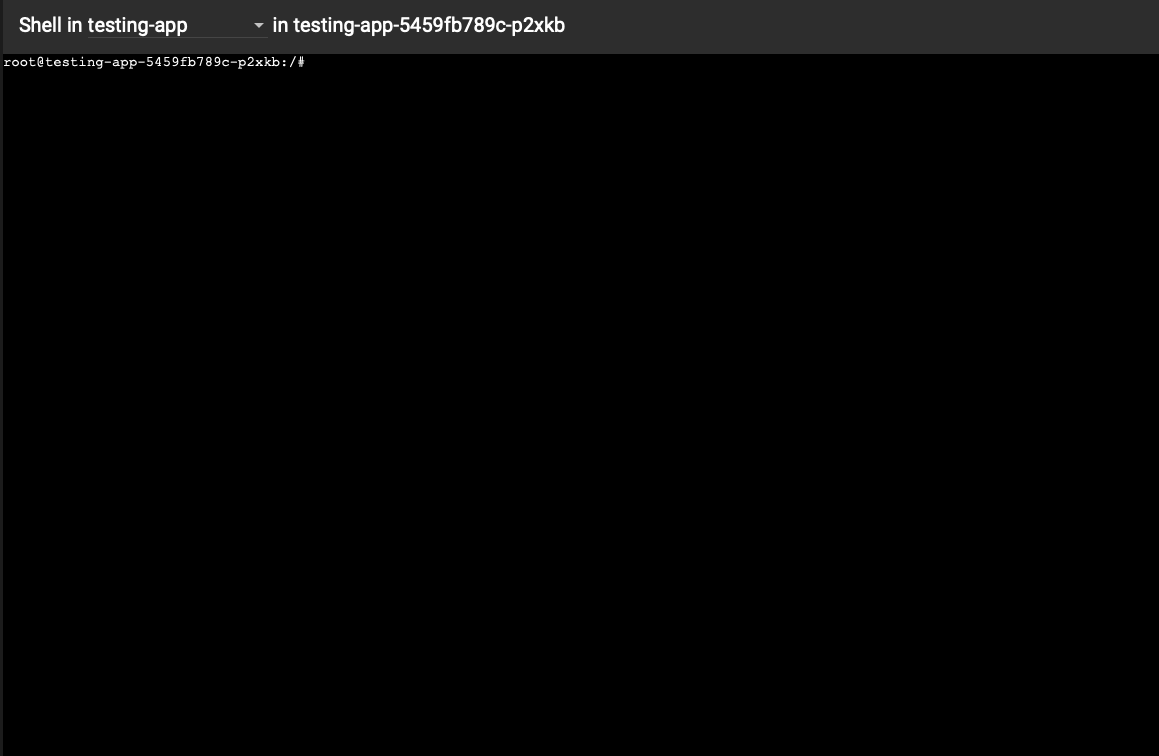
Pod interacting
In some cases, you may need to execute into the pod for testing or temporary modification. It is also a feature provided by the Kubernetes Dashboard that you can directly interact with the selected pod through the browser. You don’t need to use any SSH client and set your cluster context, as it is equivalent to the `kubectl exec` command.
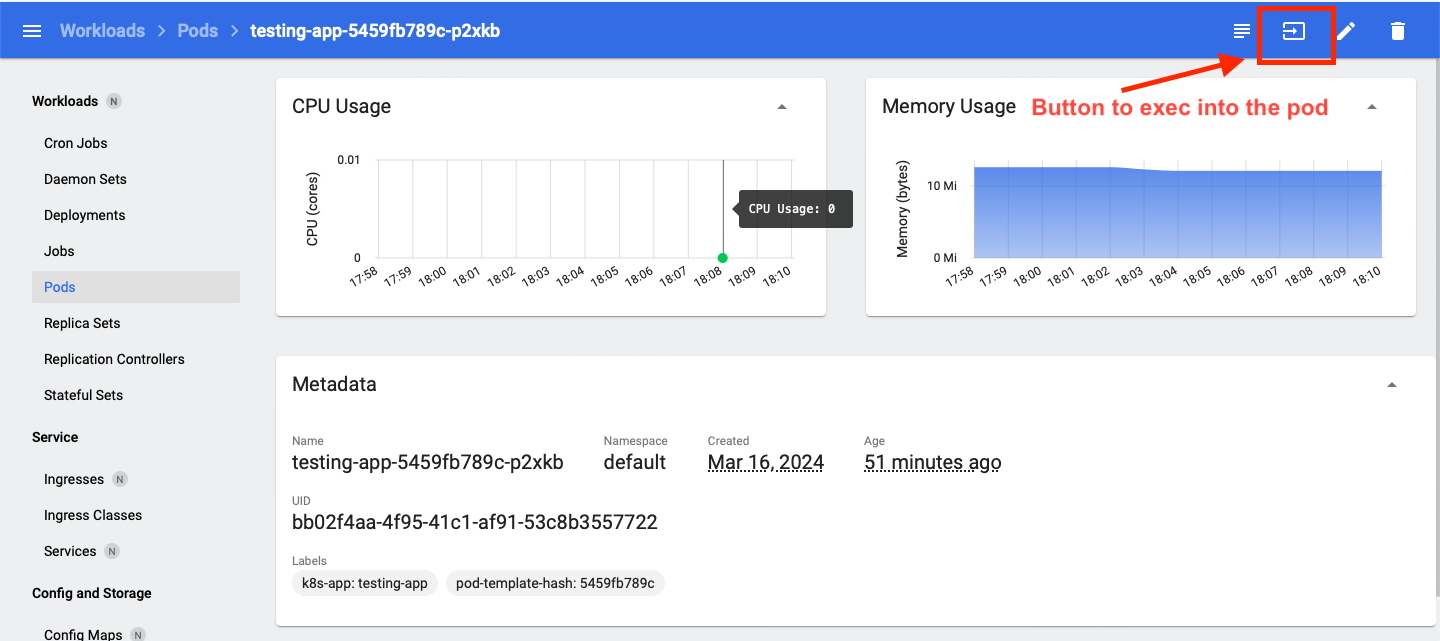
Once you click the button, you will see a Shell box to run any command. If you would like to delete all the changes made against the Pod in Shell, you can simply delete the Pod and let it recreate provided that the Pod is controlled by a Replica Set.

Conclusion
You have learned about using the Kubernetes Dashboard to simplify your daily duties as a Kubernetes cluster administrator. The dashboard is equivalent to many `kubectl` commands but in a visual way. You can dig into the dashboard and find the best way to utilize it. It brings more benefits than you expect.