
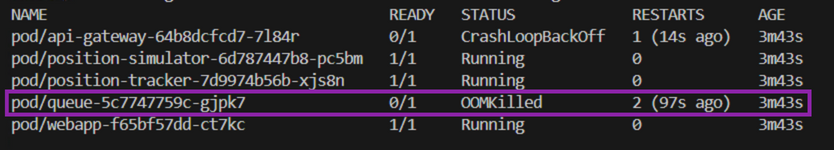
While working on a Kubernetes Microservices Architecture deployment, I encountered an error as I deployed some of my containers. As I issued the “kubectl get all” command, I was presented with the “OOMKilled” status for my pod. Here’s a terminal screenshot of the error:
I’ve spent a significant amount of time researching the root cause of the issue, ways to mitigate the problem, and approaches to scale up the infrastructure that would avoid having the problem altogether. In this brief article, my goal is to share what you can do to fix the issue, and what you need to do for your future deployments.
How do I fix exit code 137?
The OOMKilled status of a pod will imply Out Of Memory as per the acronym at the start of the status. If you were to issue the “kubectl describe pod “pod_name”” command, you’d get more information about the issue - The response will be “Exit Code: 137.
The Kubernetes engine will allocate a certain amount of memory and CPU to every container. Unless this has been specified inside of your YAML file, the pod can and will scale indefinitely if the underlying application is asking for additional resources. In other words, your deployment will come to a halt as it reaches the ceiling.
You have two options:
- You can allocate additional resources to your Kubernetes cluster.
- You set memory and CPU limits for your pods.
Depending on how you’ve deployed Kubernetes, you should be able to increase the memory and CPU allocated. Keep in mind that in most cases, a pod that has a memory leak will simply scale beyond the current limit and crash even if you increase the allocated memory and CPU resources. That being said, there are instances where the infrastructure is simply insufficient for the tasks you’re trying to run.
Setting Memory Limits on Deployments
It’s considered best practice to set the limits on CPU and memory utilisation for your pods. This configuration can be set via key-value pairs inside of the YAML file. Here’s an example of a deployment in which we’re setting limits on both CPU and memory:
You’ll immediately notice that we’ve requested 64Mi / 250m memory / CPU and have set a hard limit at 128Mi and 500m memory / CPU.
What do these values mean?
CPU resource units
Limits and requests for CPU resources within Kubernetes are quantified in terms of cpu units. Each cpu unit corresponds to either one physical CPU core or one virtual core, contingent upon whether the hosting node is a physical machine or a virtual machine running within a physical host.
In Kubernetes, the system allows for fractional requests, offering flexibility in specifying the desired computing power. When configuring a container and setting spec.containers[].resources.requests.cpu to 0.5, you are effectively soliciting half the CPU time compared to an explicit request for 1.0 CPU. Expressions like 0.1 in terms of CPU resource units are interchangeable with 100m, which stands for "one hundred millicpu" or, equivalently, "one hundred millicores."
It's important to note that CPU resources are always defined in absolute terms, irrespective of the machine's core count. For instance, 500m CPU signifies a consistent amount of computing power, whether the container is deployed on a single-core, dual-core, or a robust 48-core machine.
Kubernetes imposes a limitation on the precision of CPU resource specification, not permitting values finer than 1m or 0.001 CPU. To prevent inadvertent usage of invalid CPU quantities, it is advisable to articulate CPU units in the milliCPU form instead of the decimal form when dealing with quantities less than 1 CPU unit.
Consider a scenario where a Pod utilises 5m or 0.005 CPU, and there's a desire to reduce its CPU resources. Using the decimal form might obscure the fact that 0.0005 CPU is invalid, while the milliCPU form makes it more evident that 0.5m is an inappropriate value. This approach enhances accuracy and minimises the risk of specifying invalid CPU quantities.
Memory resource units
Memory limits and requests in Kubernetes are denominated in bytes and can be expressed either as plain integers or fixed-point numbers, using specific quantity suffixes. These suffixes include E (exabytes), P (petabytes), T (terabytes), G (gigabytes), M (megabytes), and k (kilobytes). Additionally, power-of-two equivalents such as Ei, Pi, Ti, Gi, Mi, and Ki can be used. To illustrate, the following representations approximate the same value:
- 128974848
- 129e6
- 129M
- 128974848000m
- 123Mi
It is crucial to be mindful of the case of the suffixes. For instance, if a request specifies 400m of memory, it is, in fact, a request for 0.4 bytes. In such cases, the intention might be to request 400 mebibytes (400Mi) or 400 megabytes (400M). Careful attention to the unit suffixes ensures accurate memory allocation and prevents potential errors in specifying memory quantities.
Understanding the OOMKiller Mechanism
As I’ve mentioned in the introduction, I’ve noticed the issue while deploying pods into my cluster. You may have experienced a similar scenario. To that point, here’s what I witnessed before the pod was shut down with the “OOMKiller” message.
I run a local installation of Kubernetes on Windows using minikube and Docker Desktop. I had two pods and respective services running before I ran into trouble. As I deployed the change to the YAML file that container the application that ultimately caused the issue, everything started off as expected.
The kubernetes engine processed the file without any errors or warnings and the deployment began downloading the single replica I had specified. Once the files finished downloading the pod was deployed. As expected, at first the pod was in a “Running” state. I didn’t write this application, so naturally, I didn’t know all the details of operation. As the message queue began generating messages to be processed by this application, the CPU fan began spinning.
I immediately ran the “kubectl get all” command and didn’t get a response - the minikube service was completely unresponsive. I verified the Task Manager and sure enough, the memory utilisation and the CPU utilisation were peaking.
After a while (~2-5minutes), I was able to get information from kubectl commands again. As I had expected, the engine had killed the pod. However, as we all know, Kubernetes immediately attempts to restart any pod that isn’t running per the specification of a Deployment. Since I had specified one replica of the pod and there were 0 replicas, Kubernetes attempted to start a new pod.
The cycle repeated - the pod ran out of memory.
The Out of Memory Mechanism (OOMKiller) is a Linux mechanism that prevents the system from running out of memory by selectively terminating processes that exceed certain thresholds. As the processes “fight” over CPU and memory resources, Linux continuously monitors their usage and evaluates which ones need to be terminated.
The OOMKiller will use different parameters to figure out what’s worth keeping and what needs to be terminated - the obvious first thing to keep track of is “which application is consuming the most”? The Linux kernel will also prioritise applications based on how essential they are to the system. In other words, you can assign a priority level to the application to ensure that it doesn’t get terminated over another.
The OOMKiller process is a “last-resort” protocol that is invoked when the system is close to running out of memory or CPU resources.
Under the hood, the Linux kernel employs an oom_score for each active process on the host, influencing the likelihood of termination based on the assigned score.
The oom_score_adj value provides users with the ability to customize the Out-Of-Memory (OOM) process, dictating when processes should be terminated. In the context of Kubernetes, this value is instrumental in defining the Quality of Service (QoS) class for a given pod.
There are three distinct QoS classes that can be assigned to a pod, each aligned with a specific oom_score_adj value:
- Guaranteed: -997
- BestEffort: 1000
- Burstable: min(max(2, 1000 — (1000 * memoryRequestBytes) / machineMemoryCapacityBytes), 999)
The QoS classes play a pivotal role in determining the order of process termination when a node approaches memory exhaustion. Pods with the Guaranteed QoS class, assigned a lower value of -997, are the last to be terminated on a memory-constrained node. Conversely, BestEffort pods, with the highest value of 1000, are the first to face termination.
To ascertain the QoS class of a specific pod, execute the following command:
To connect to a specific pod and inspect the oom_score and oom_score_adj values, execute the following commands using kubectl:
This command opens an interactive shell within the specified pod.
Next, to view the oom_score, run:
This will display the oom_score for the process within the pod.
Similarly, to view the oom_score_adj, run:
These commands will provide insights into the Out-Of-Memory (OOM) scores for the specific process within the pod, allowing you to assess its prioritization in memory termination scenarios.
Conclusion on exit code 137 and OOMKiller in Kubernetes?
If you run into the OOMKiller or exit code 137 issue, you know why and what to do. Properly managing the CPU and memory resources allocated to your containers is key. Make sure to specify limits and verify the status of your assets on a regular basis to ensure that they’re not at the limit.